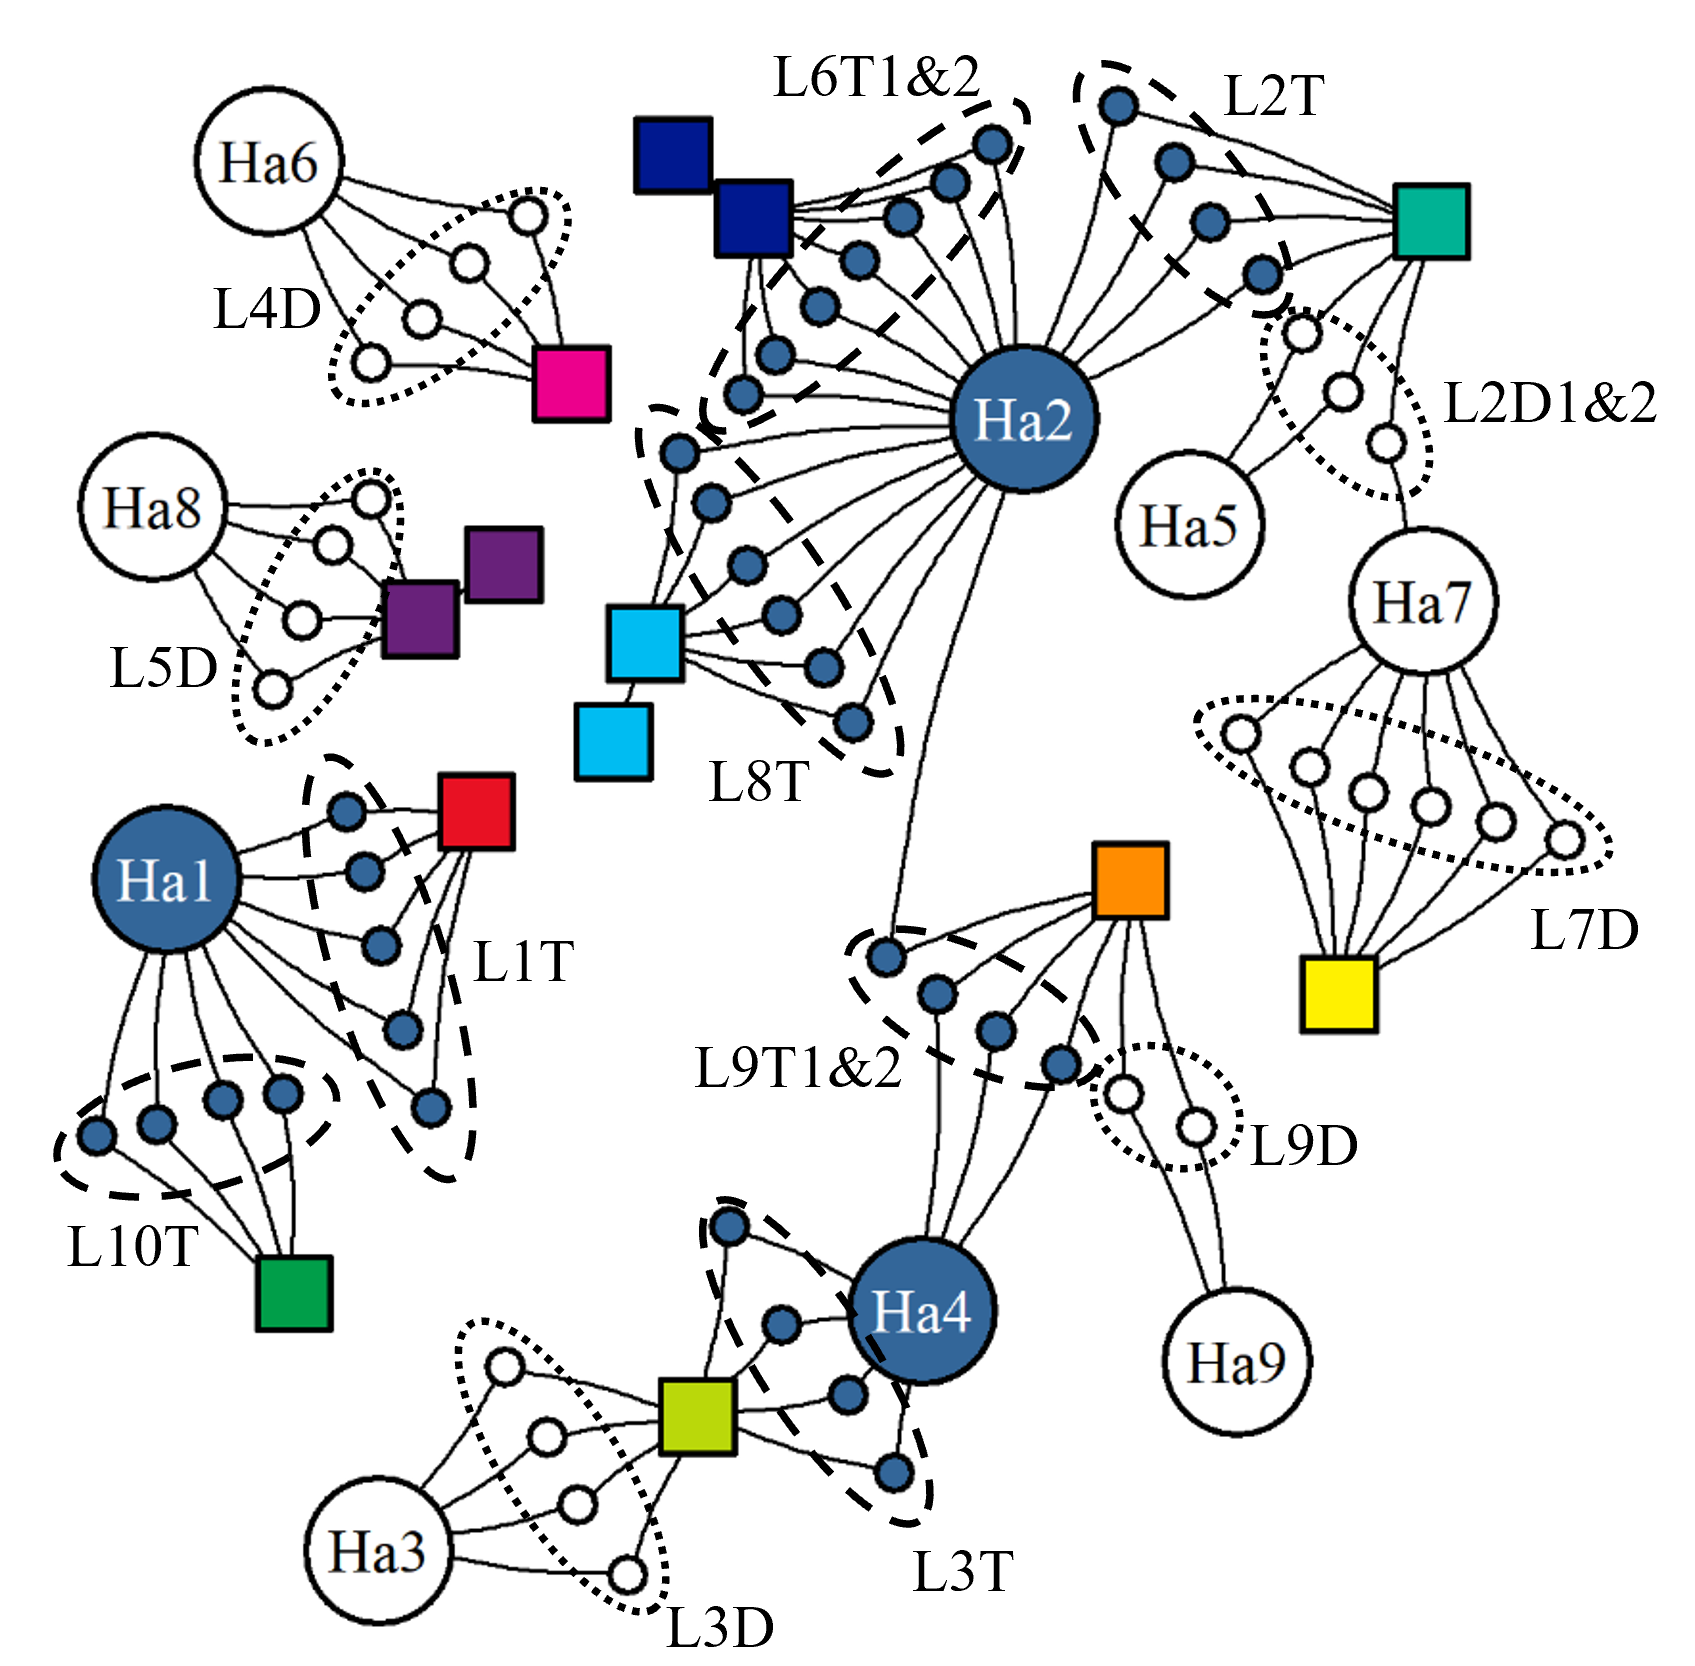
Figure 15. Fish Group Network, showing connections between hatcheries (circles), farms (squares), and sea cages with individual fish group (small circles). The fish type present at each node is shown by the filled colour of the circle, where blue=triploid and white=diploid. The farm identities are given by the colour of the square nodes and in the naming of the attached groups.