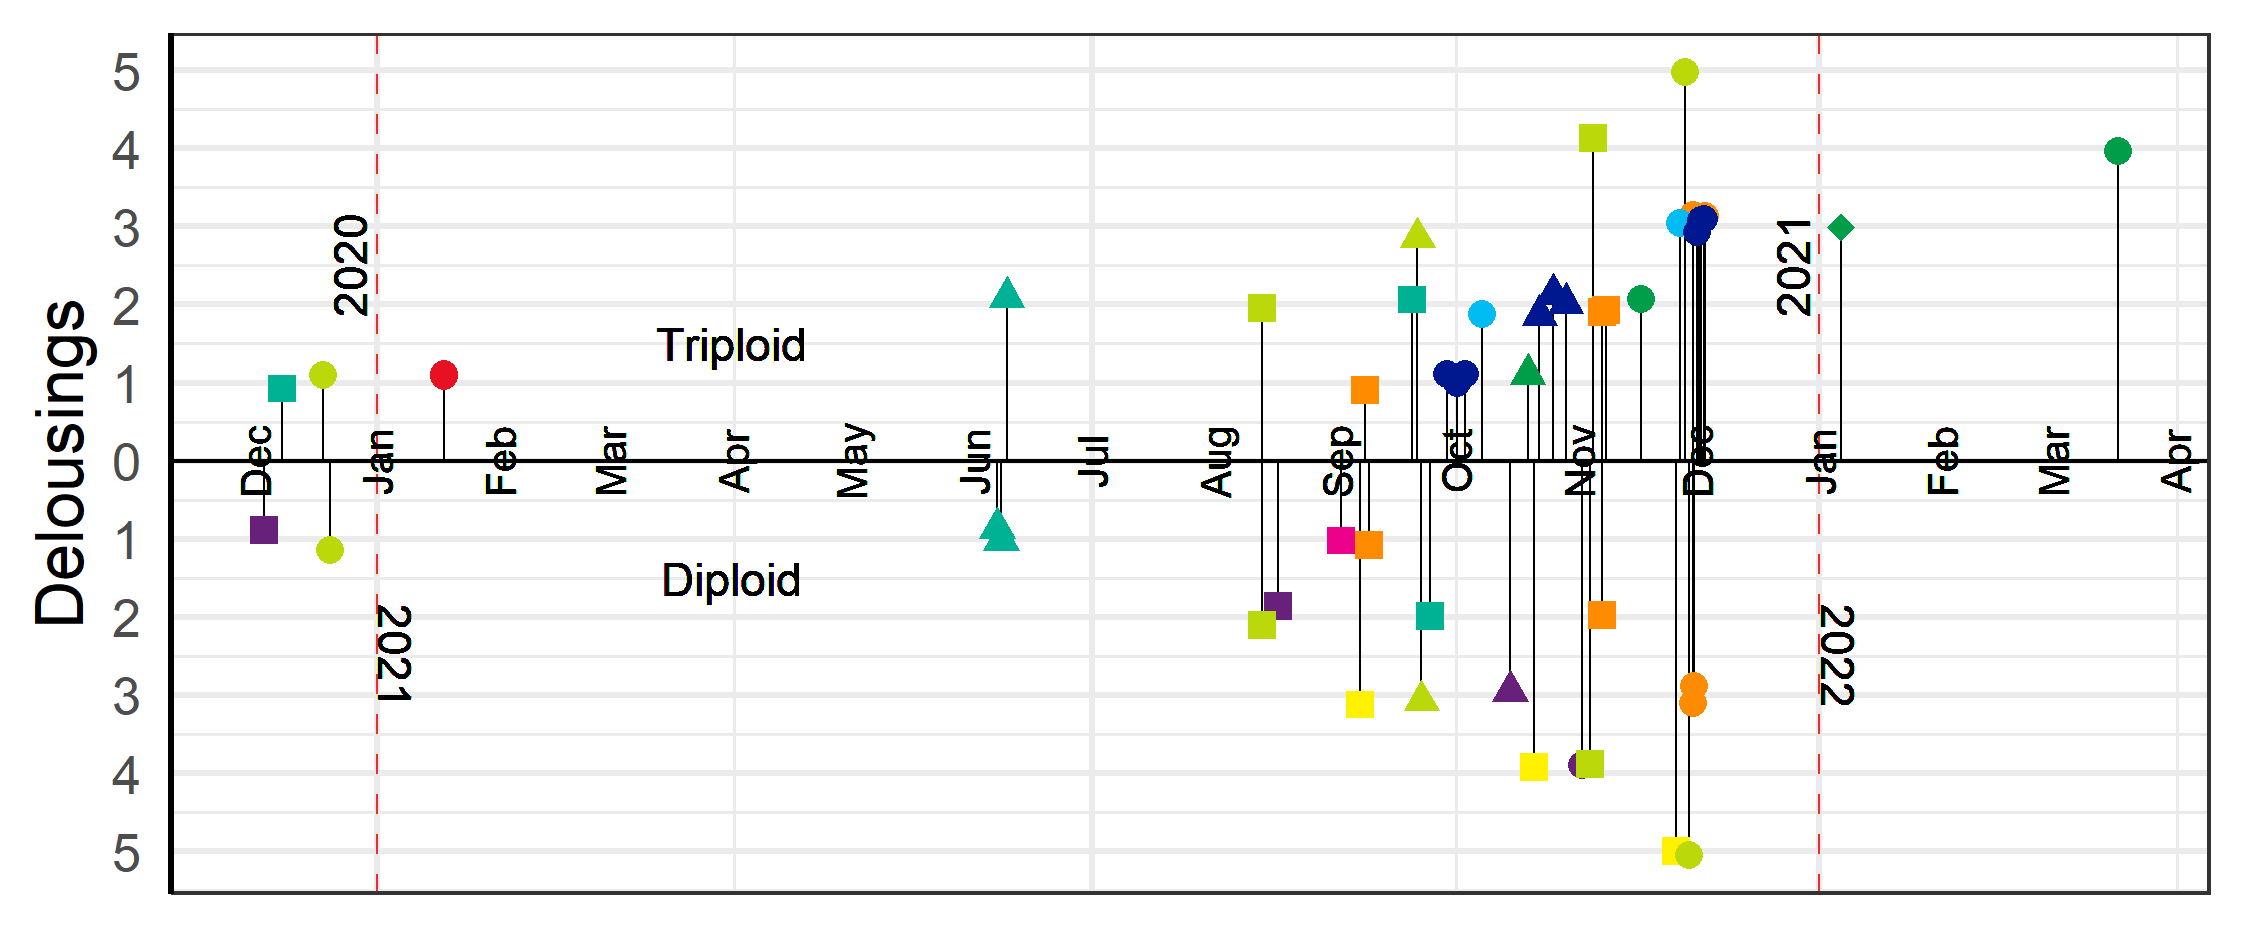
Figure 7: Timeline for delousing events Nov 2020-March 2022. Y-axis indicates cumulative number of delousing operations (P) for the given fish group. The farm identities are given by the colour of the symbols (see Figure 1). Shape of symbol indicates delousing type, ♦ = Freshwater, ▲ = Mechanical, ● = Medicinal, and ■ = thermal.