Gå til hovedinnhold
Havforskningsinstituttet
HI
English
<- Tilbake
Søk
Søk
Søk
View page in English
Figur
Fra rapporten:
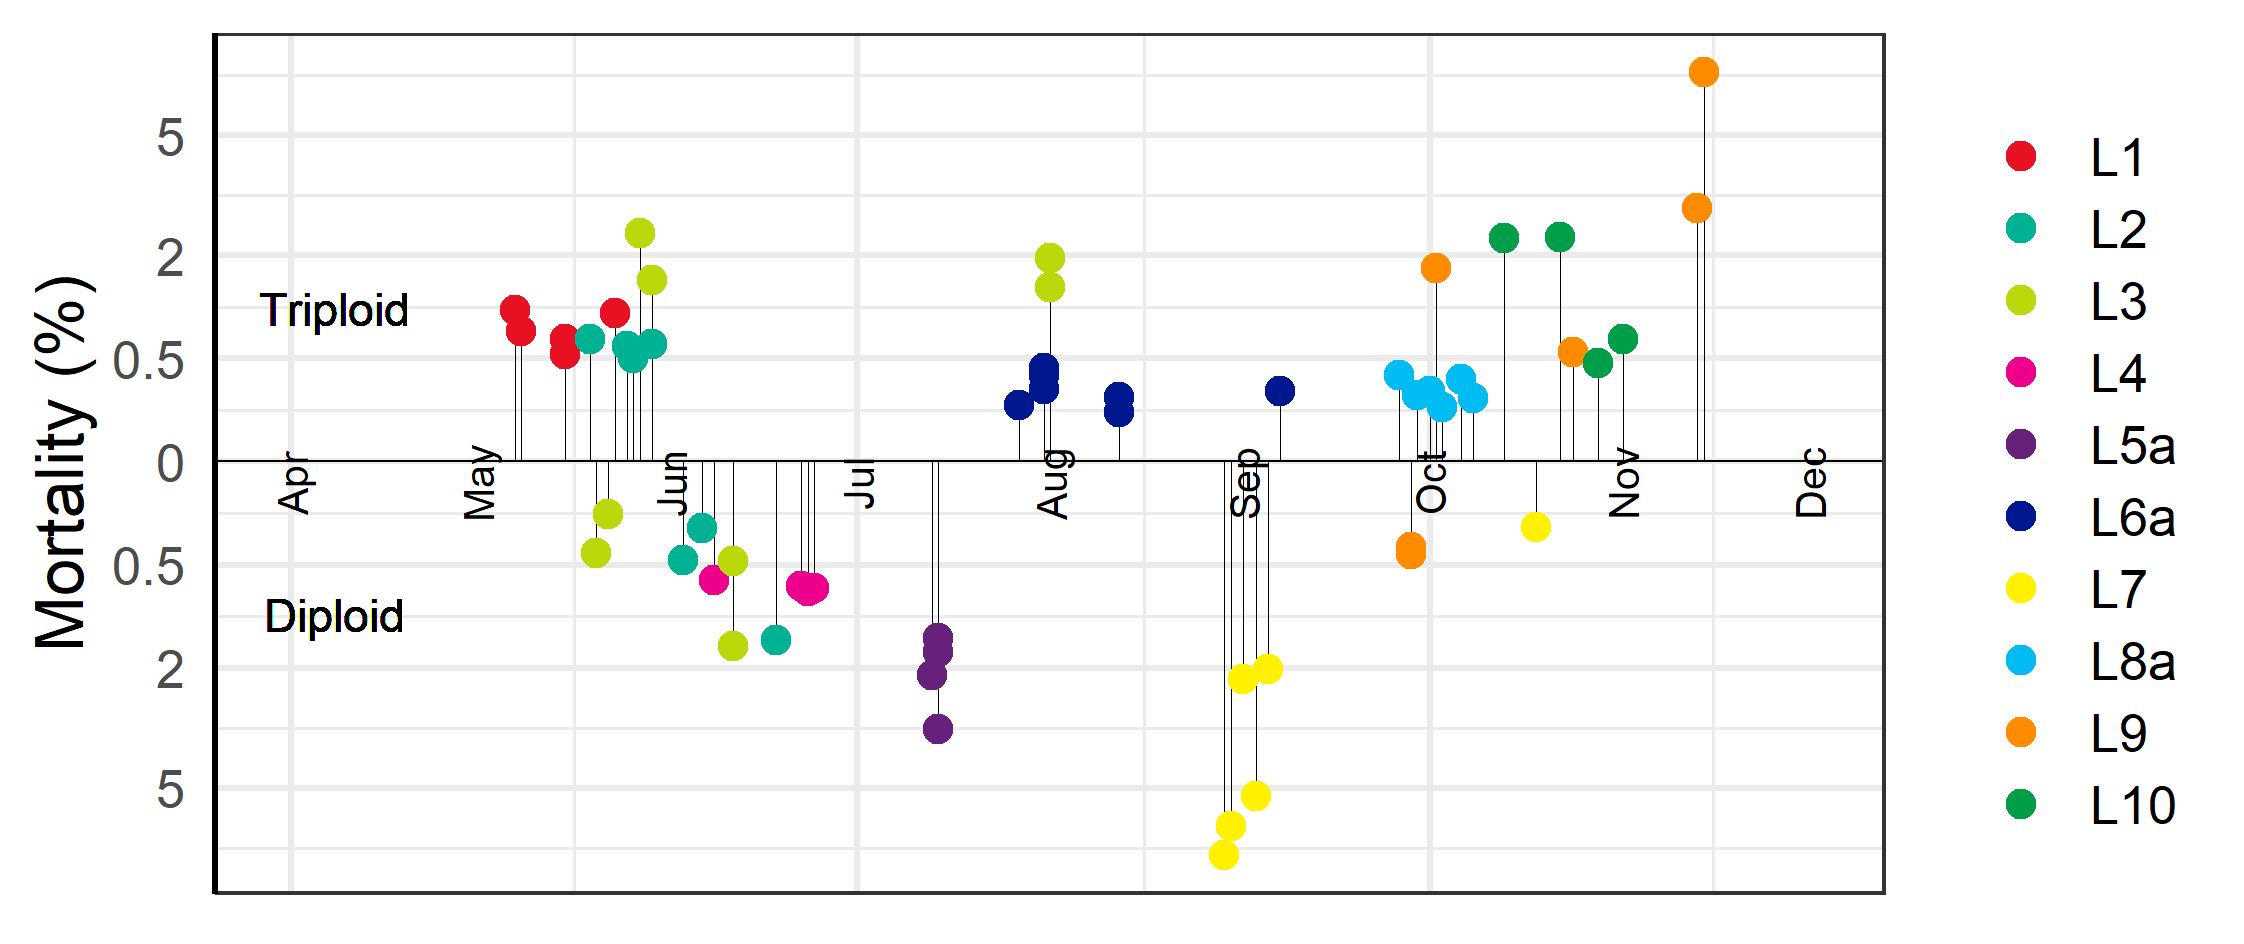
Production, fasting and delousing of triploid and diploid salmon in Northern Norway
Figure 1: Timeline for sea transfer to sea cages 2020. Y-axis indicates transfer mortality (accumulated mortality after 1 month, dead + euthanized). Triploid salmon above x-axis, diploid below. All the sea cages at a farm have the same colour.