Gå til hovedinnhold
Havforskningsinstituttet
HI
English
<- Tilbake
Søk
Søk
Søk
View page in English
Figur
Fra rapporten:
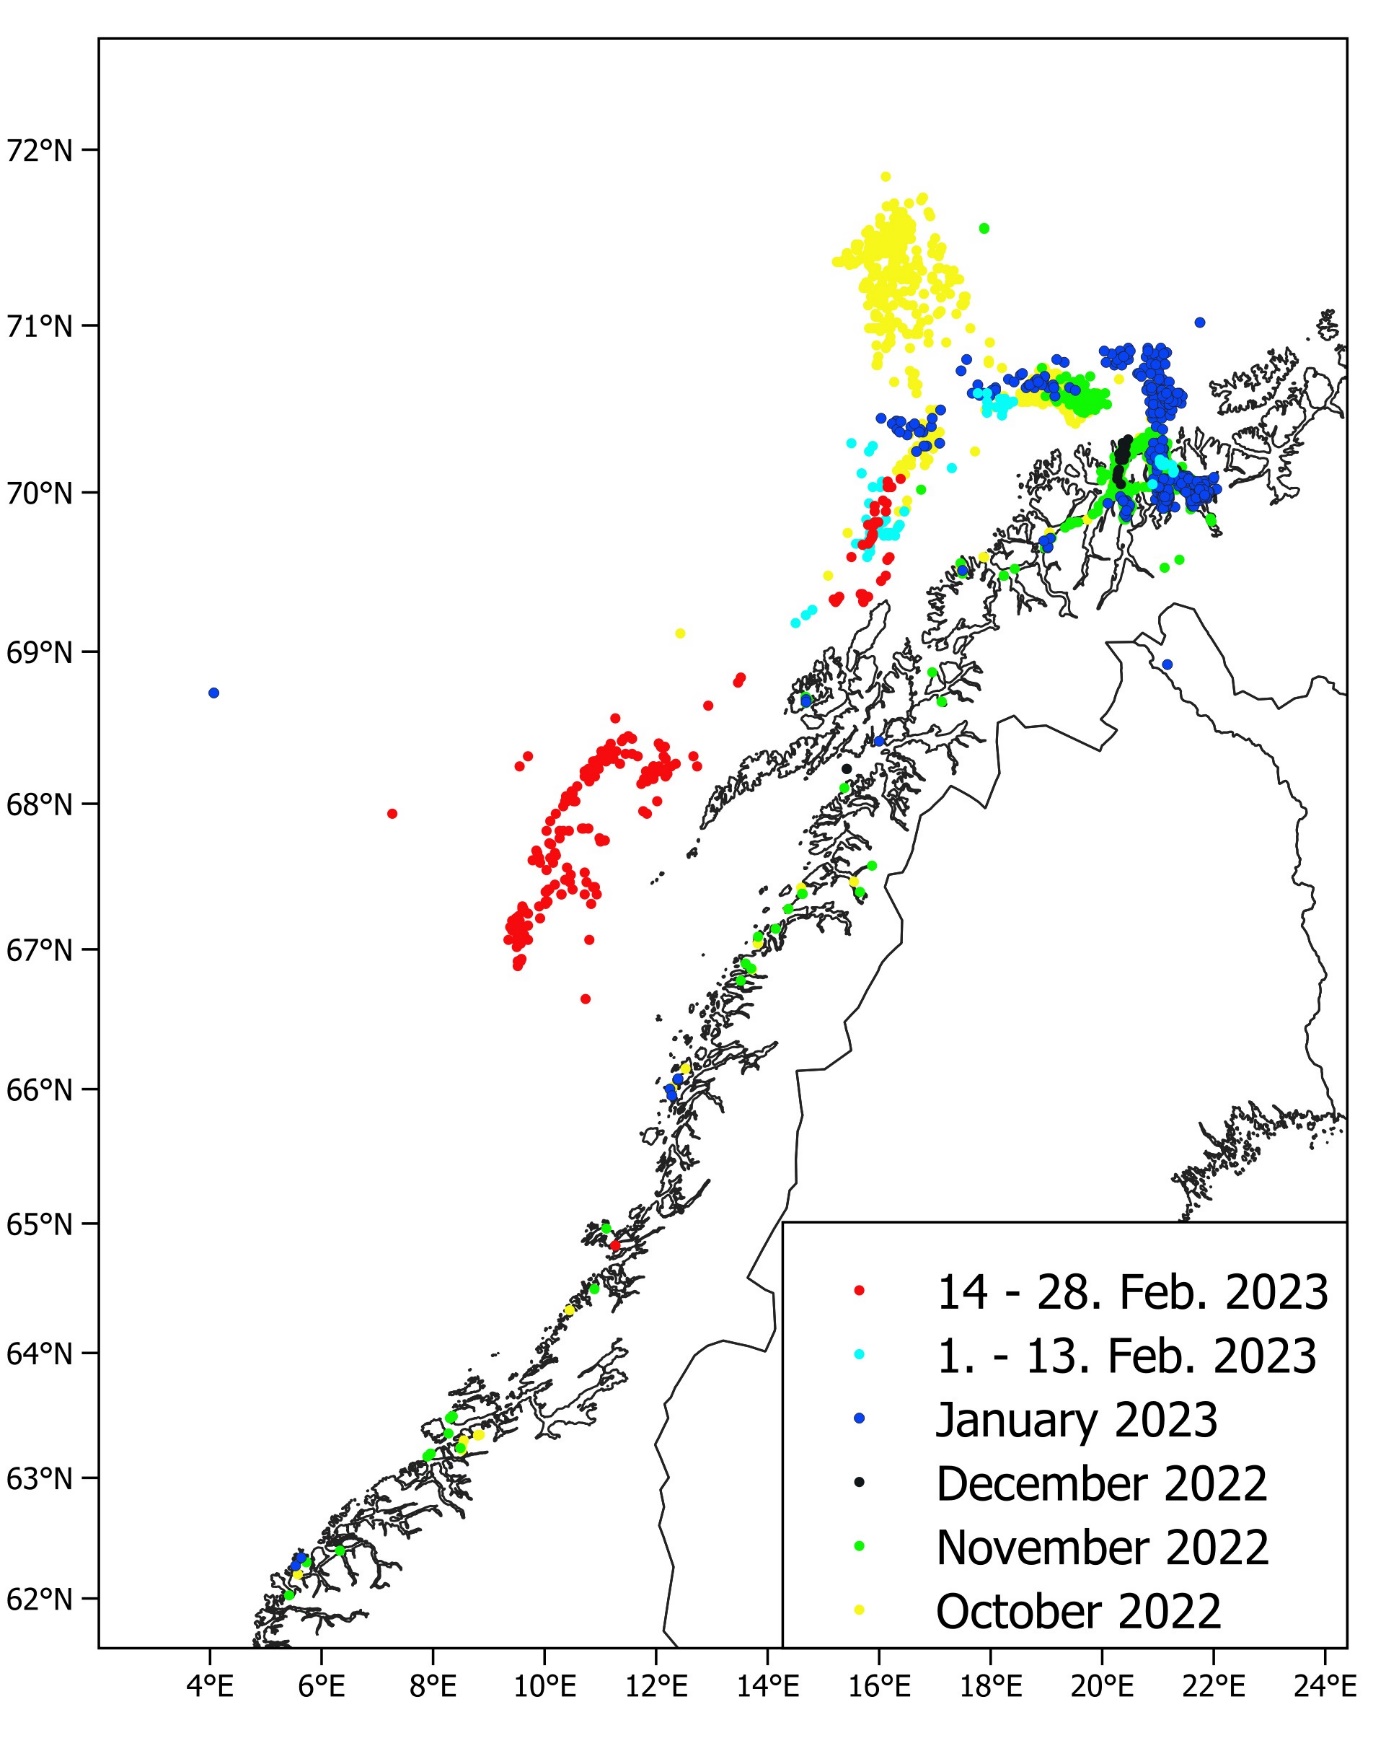
Distribution and abundance of Norwegian spring-spawning herring during the spawning season in 2023
Figure 1. Distribution of commercial catches of Norwegian spring-spawning herring from October 2022 until February 2023, based on electronic logbooks. Each point represent one catch, only catches larger than 10 tons are shown.