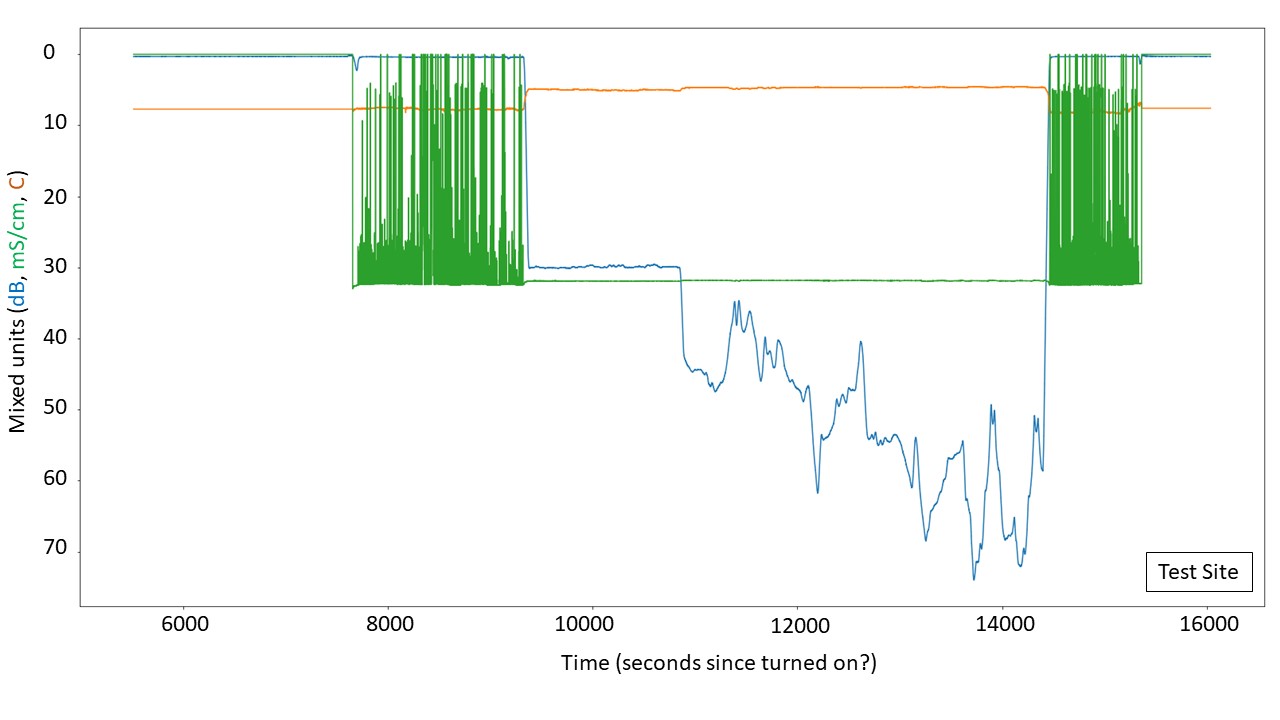
Overview CTD graph from the test site: Blue line: pressure (dB), green line: conductivity (mS/cm), orange line: temperature (C). The units are not specified in the files and are to be considered as reasonable assumptions. The x-axis is time, in mystery units. It might fit with seconds since the AUV was turned on. The “forests” in the conductivity data corresponds to time the AUV was spending in the sea, but on the surface, where the CT sensor was bobbing in and out of the water.