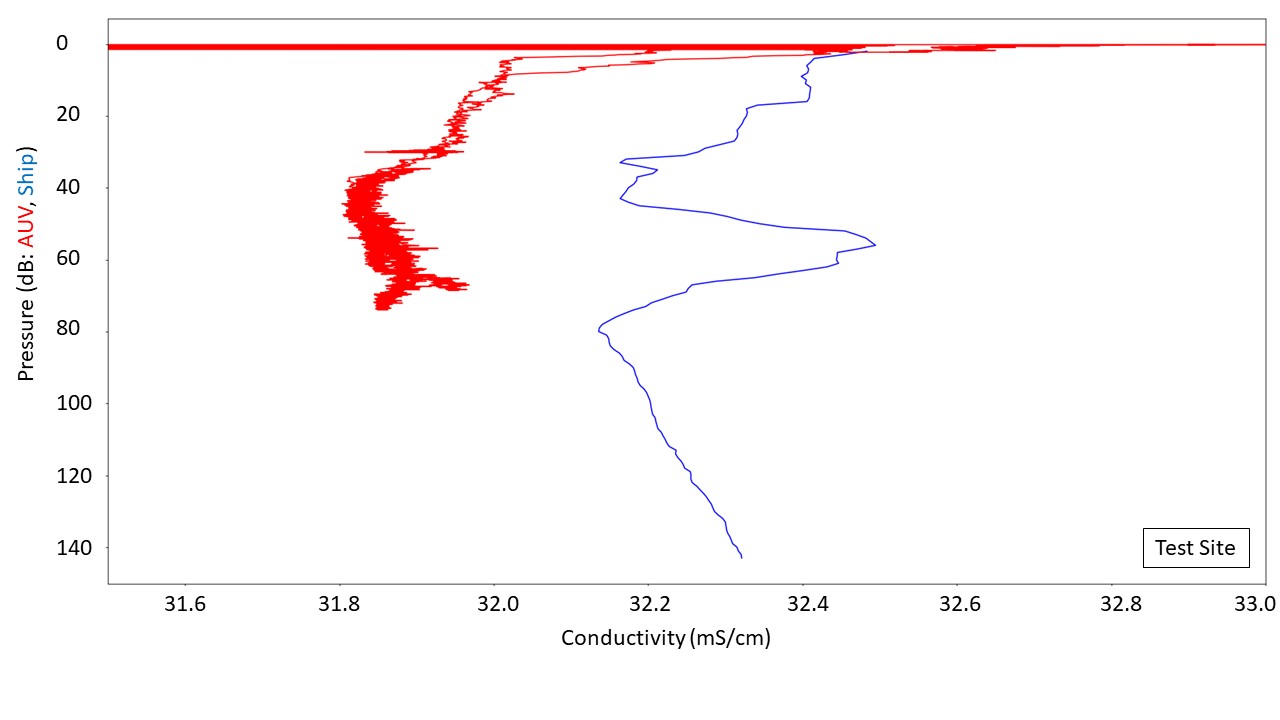
Comparison between shipborne and AUV conductivity. The shipborne CTD was taken in a deeper area slightly off the site. The ship CTD uses S/m units of conductivity – these have been multiplied with 10 to match the units from the AUV. The most glaring difference is an offset of about 1%. In the upper part of the water column, the profiles otherwise reproduce the general shape of the profile, and the spike at 30m depth. The thick part of the AUV graph corresponds to the AUV moving near the bottom, covering an extended area with varying depth. The shape of the profile here does not match that of the shipborne CTD well, but since the AUV test area is in a strait and, and the CTD station in deeper water, this might be due to real differences in the water properties.