Gå til hovedinnhold
Havforskningsinstituttet
HI
English
<- Tilbake
Søk
Søk
Søk
View page in English
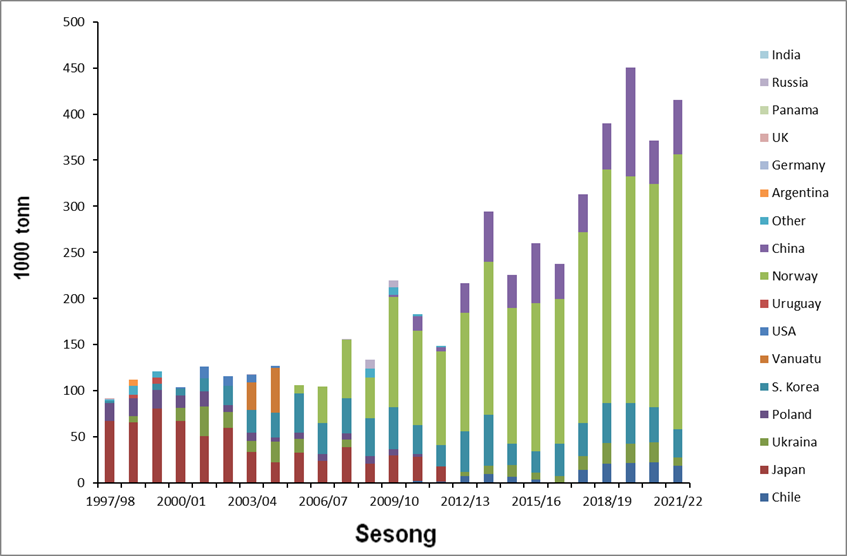
Figur
Fra rapporten:
Antarctic krill and ecosystem monitoring survey off the South Orkney Islands in 2023
Figure 1. Annual total catch per flag state in the CCAMLR subareas 48.1, 48.2, 48.3 and 48.4, since 1997/98 to 2021/22 (data source: CCAMLR.org).