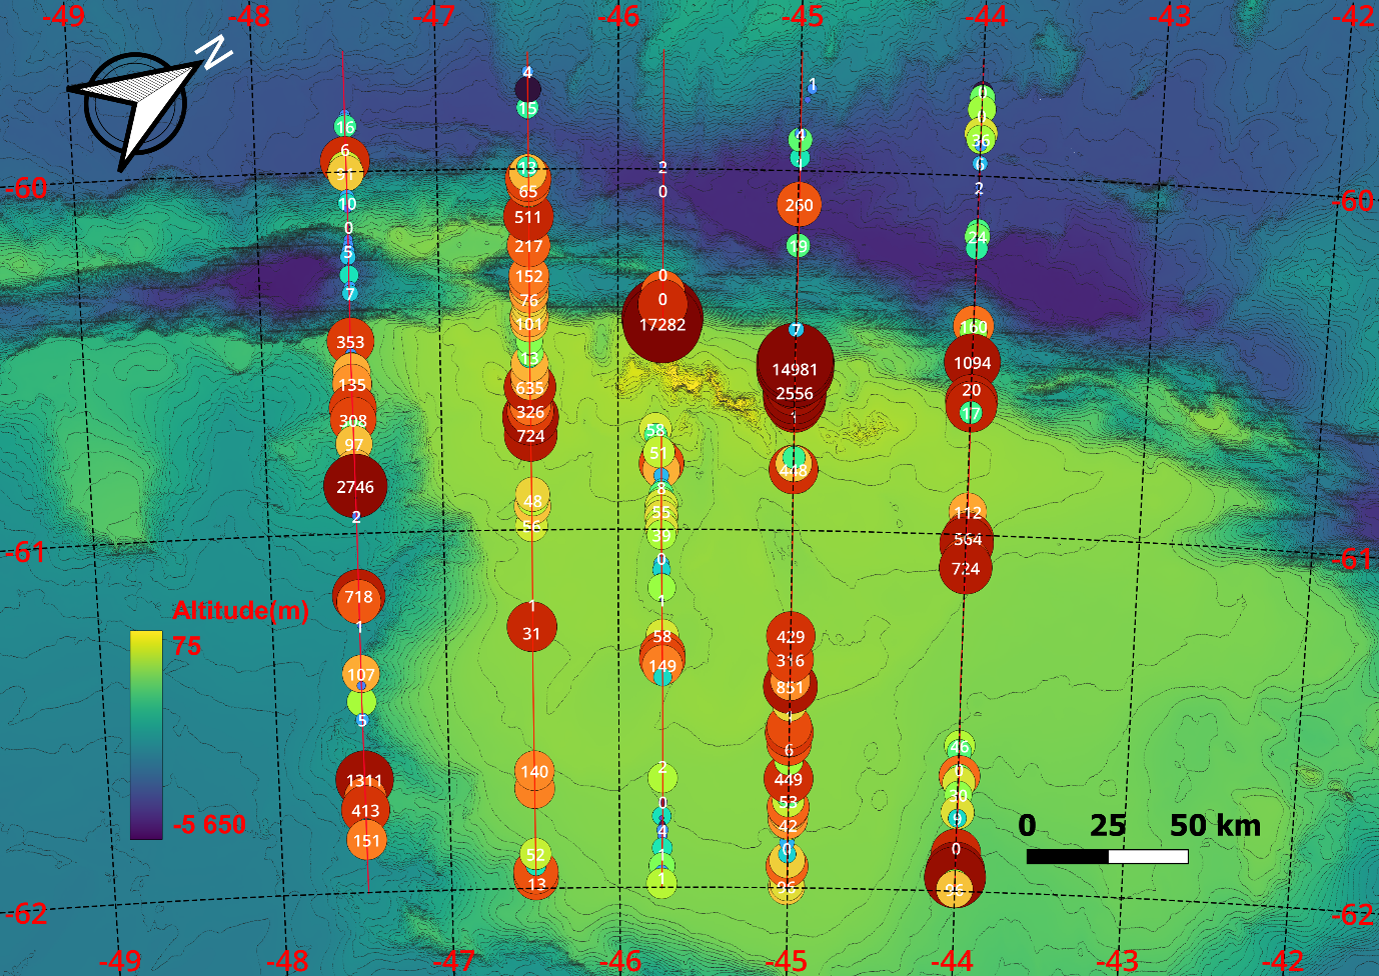
(b)
Figure 6. Distribution of Nautical Area Scattering Coefficients (NASC; m2/nmi2) allocated to E.
superba (red) and other targets (grey) from the 120 kHz recordings. Log distance is 1 nautical mile. The symbols are not linearly scaled due to space. (a) the Shelf edge stratum, (b) the overall stratum.