Gå til hovedinnhold
Havforskningsinstituttet
HI
English
<- Tilbake
Søk
Søk
Søk
View page in English
Figur
Fra rapporten:
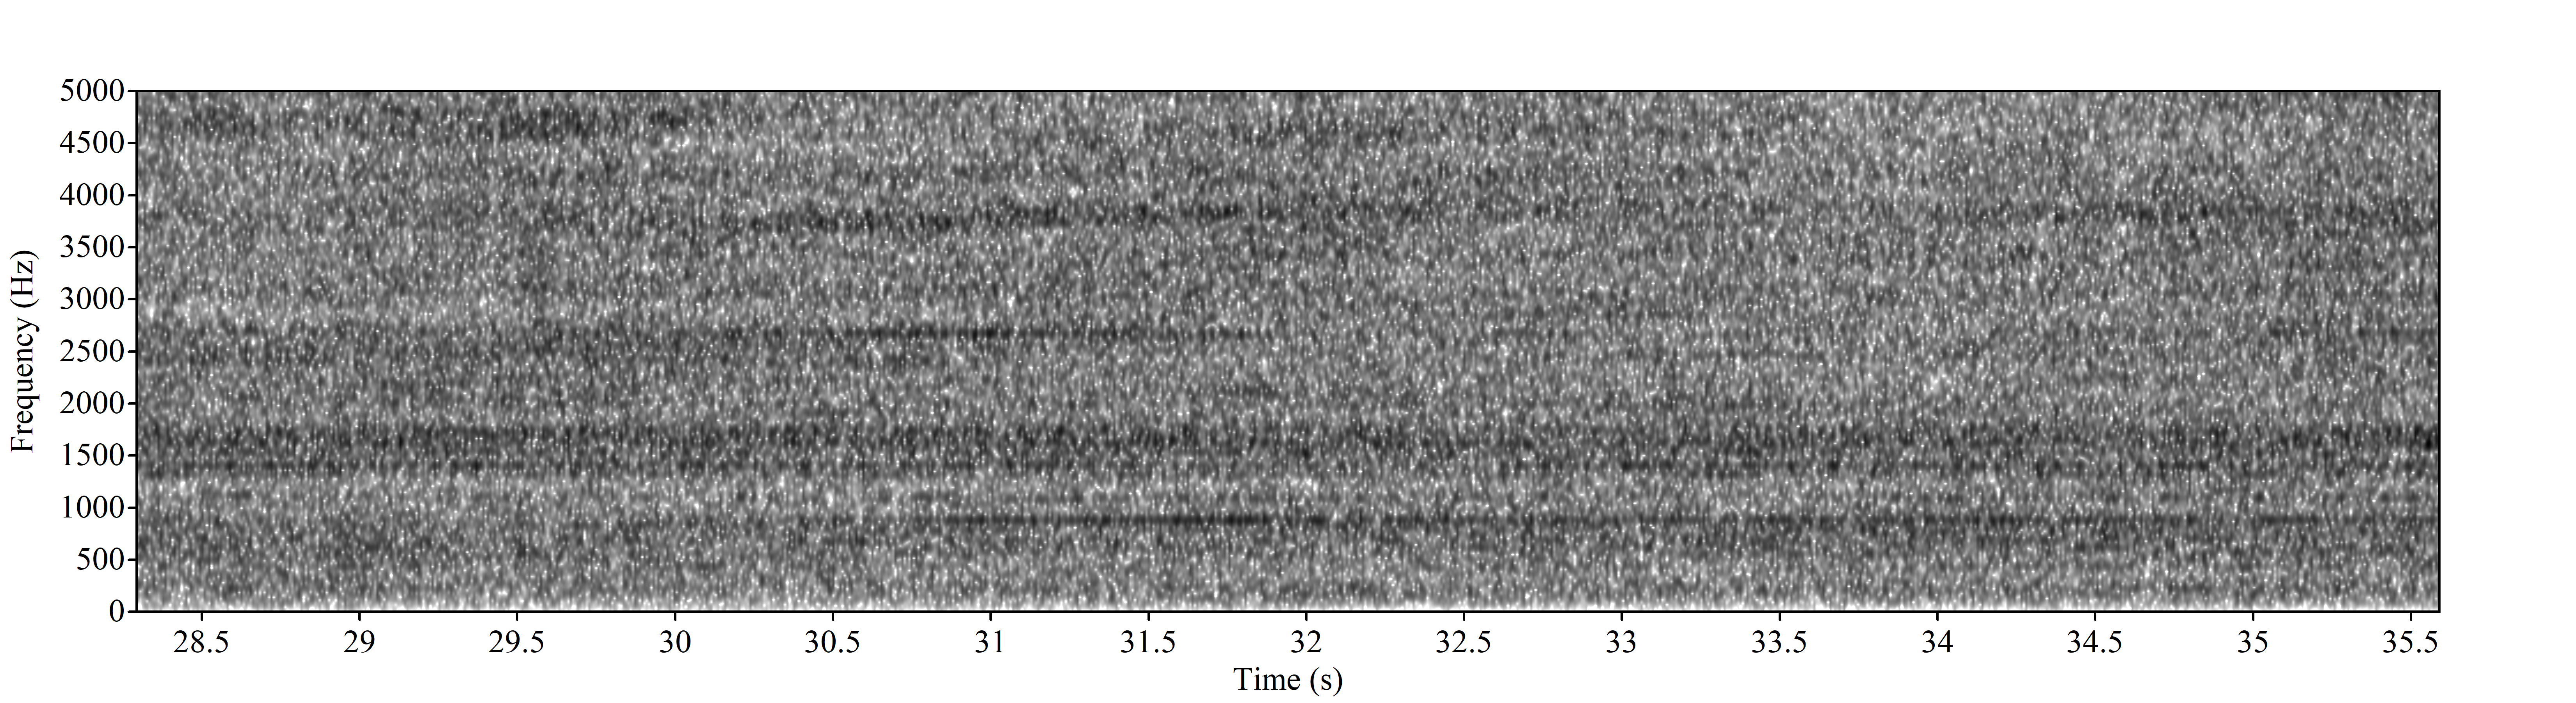
Cruise report Hywind Tampen 13 to 28 March 2023
Figure 9. Spectrogram from a representative 10s recorded with one of the SoundTraps.