Gå til hovedinnhold
Havforskningsinstituttet
HI
English
<- Tilbake
Søk
Søk
Søk
View page in English
Figur
Fra rapporten:
Cruise report Hywind Tampen 13 to 28 March 2023
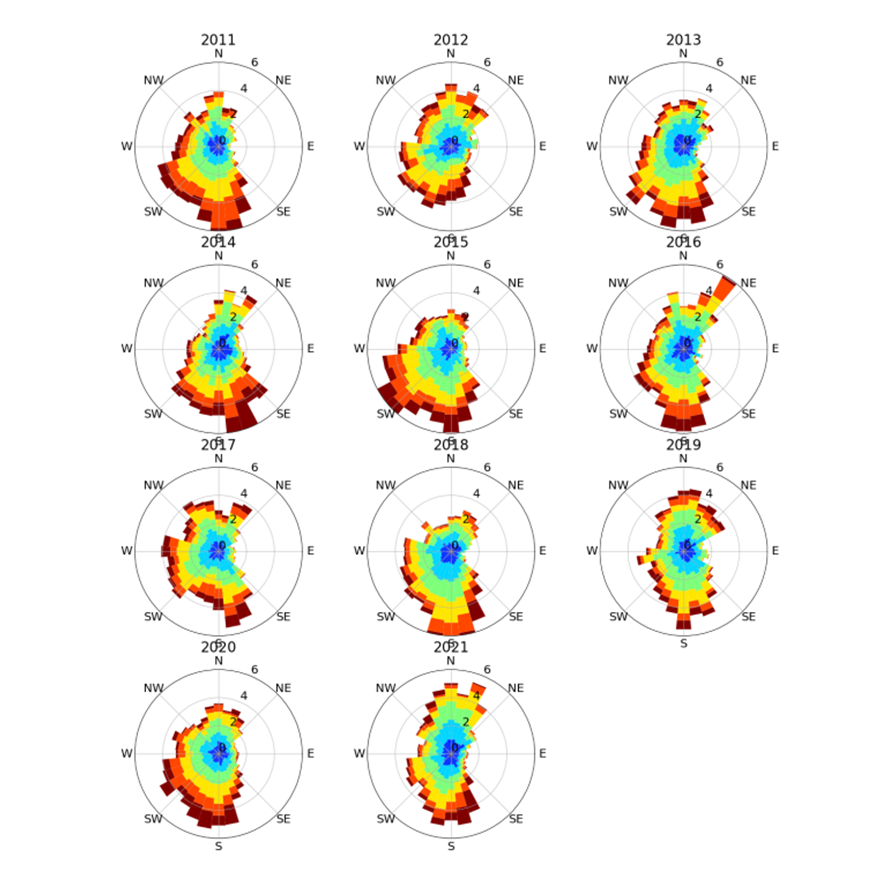
Figure 7. Rose plot of wind speeds and directions between 2011 and 2021.