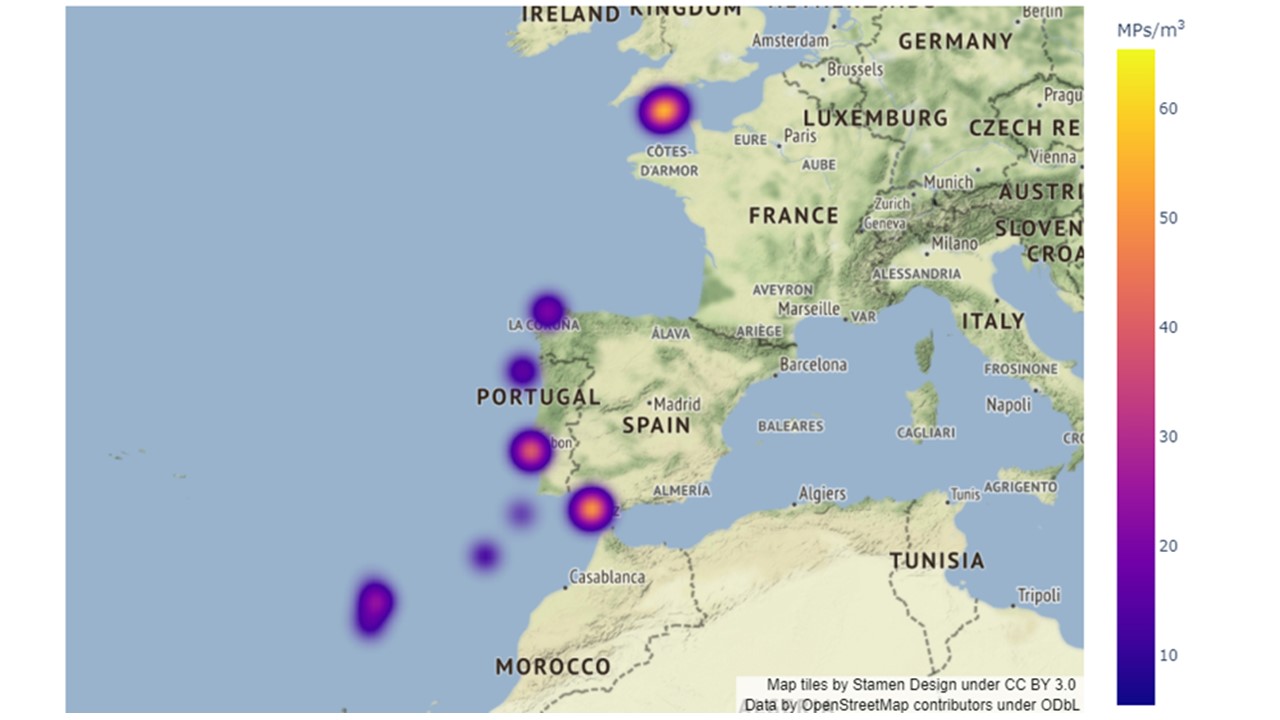
Figure 10. Occurrence of microplastic particles (MPs) in the first part of the survey shown as a density plot. Brighter colour indicates higher density of microplastics, normalized to particles per m3. The highest density measured was 65 particles per m3.