Gå til hovedinnhold
Havforskningsinstituttet
HI
English
<- Tilbake
Søk
Søk
Søk
View page in English
Figur
Fra rapporten:
Seleksjon i reketrål: overlevelse til reker som selekteres ut i overflaten
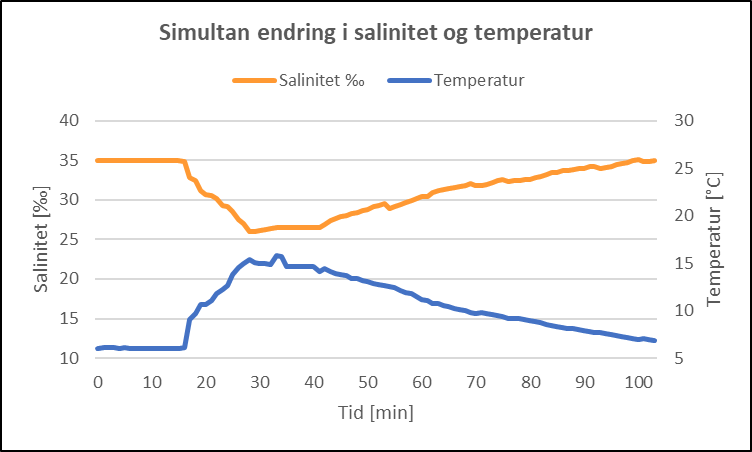
Figur 13 . Forsøk 5. Simultan endring i salinitet (35 ‰→ 27 ‰→ 35 ‰) og temperatur (6 °C→ 15 °C→ 6 °C).