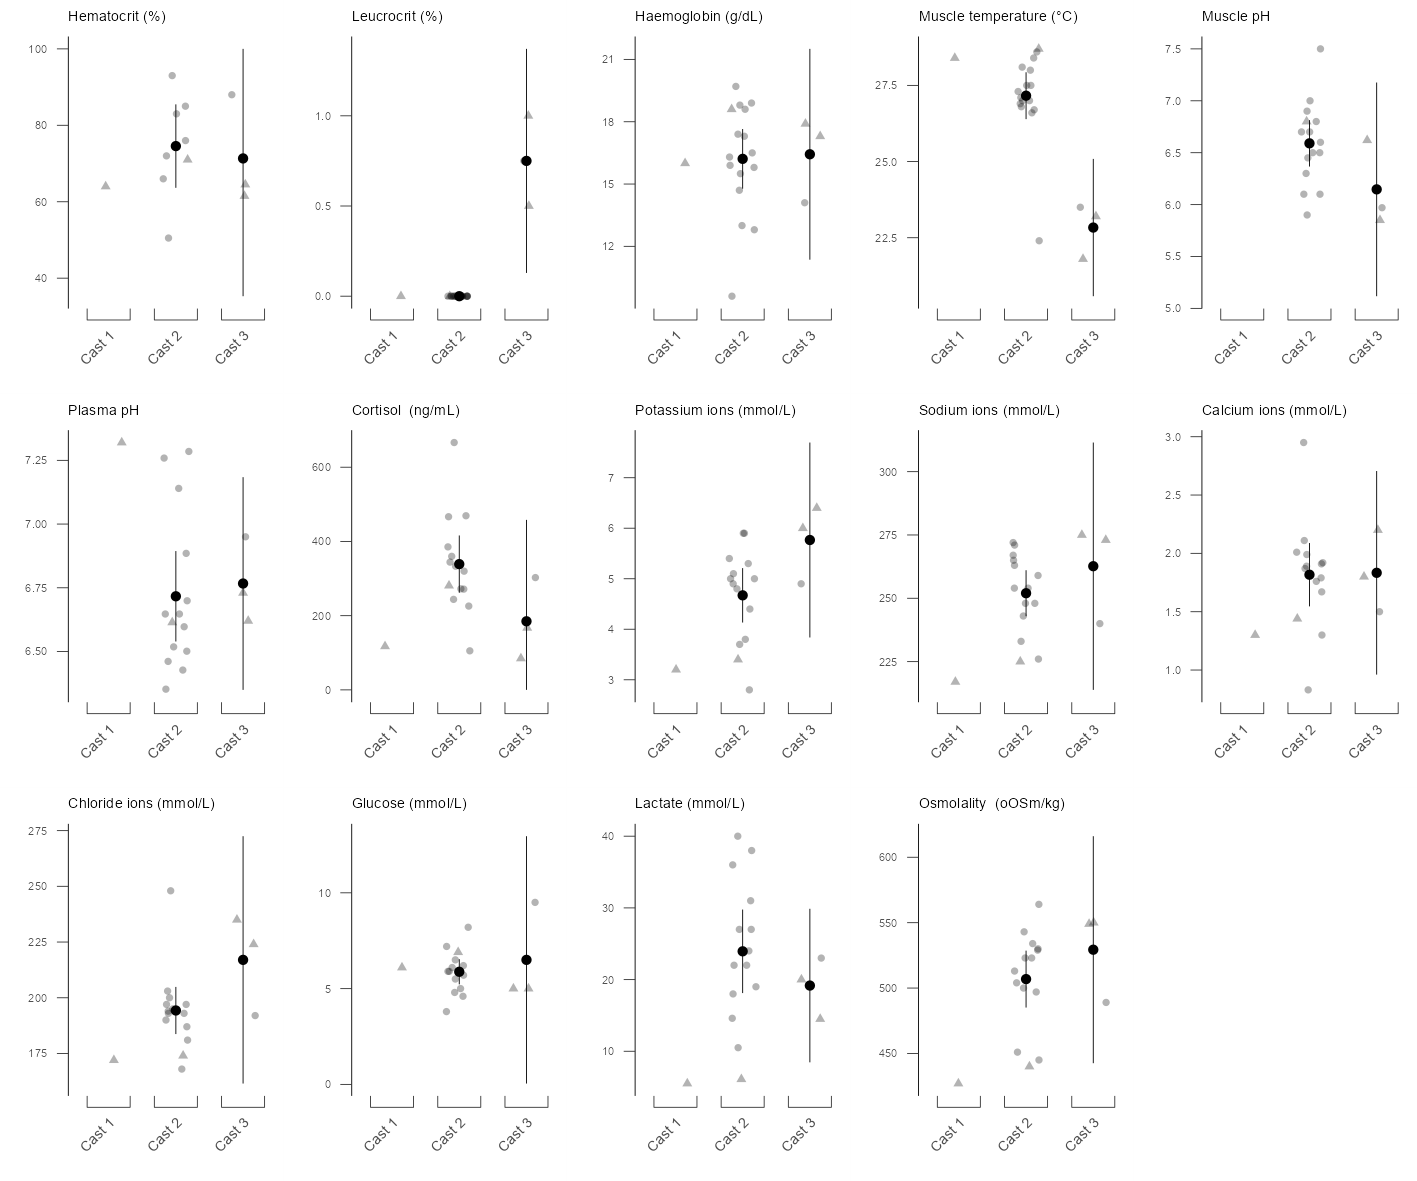
Figure 15: Physiological responses to short-term live-storage in bluefin tuna. Cast 1 & 2 = fish caught by purse seine and transferred to a transfer cage, which was towed for ~1 day. Cast 3 = caught by purse seine and transferred to a transfer cage which was towed for ~1 day. Fish were then transferred to an inshore stationary cage and held for ~10 days. For all casts, slaughter was achieved by reducing cage volume and “drying” the fish. Black circles and whiskers represent sample means and 95% confidence intervals respectively. Grey points indicate raw data, with triangles for fish that were electrically stunned during the slaughter process.