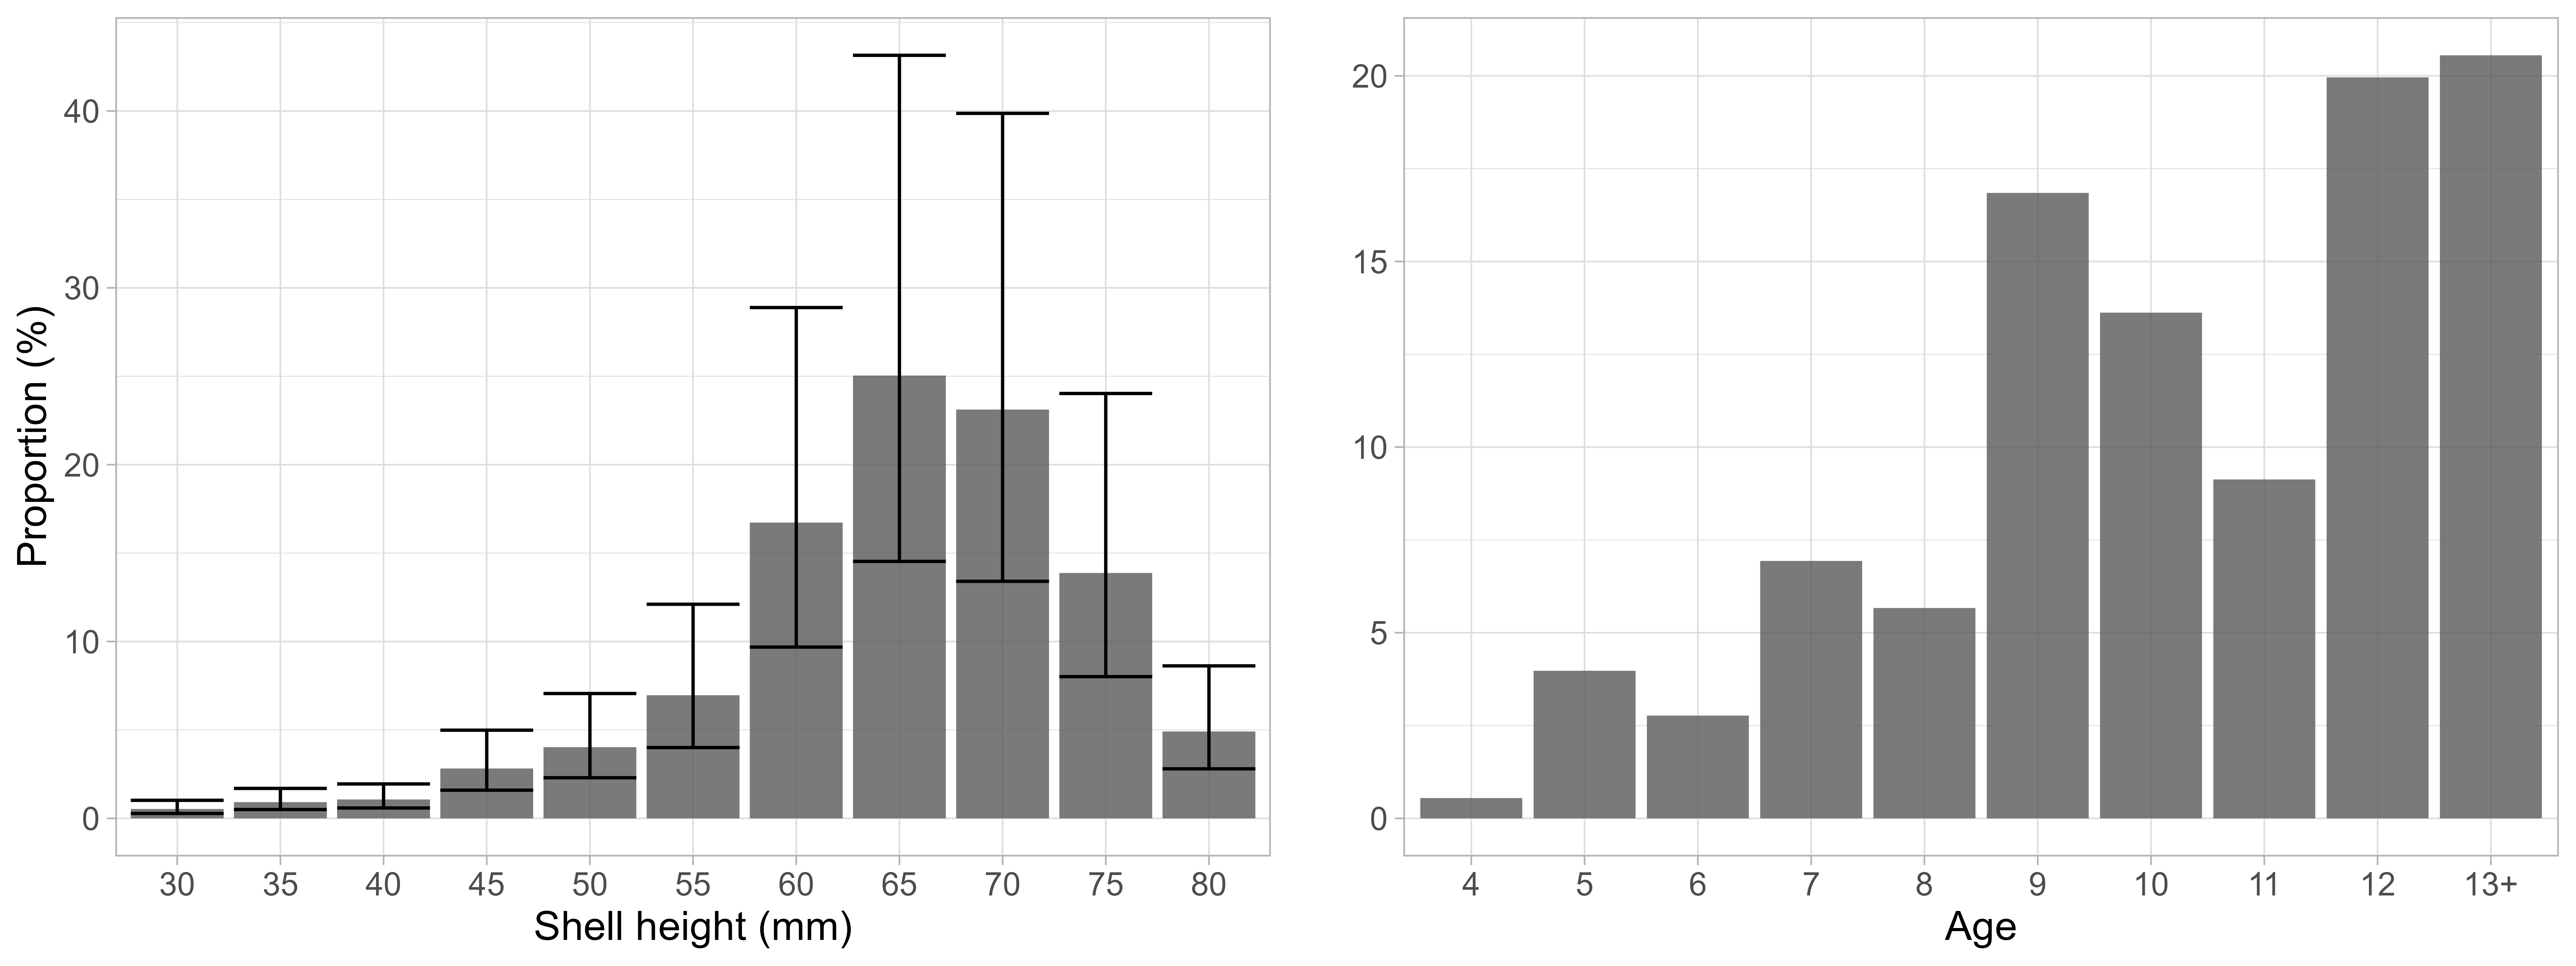
Figure 18: Scallop length and age frequencies estimated using spatial GAMM. Shown are the relative abundances per length group (left) or age class (right) represented by the mean (bars) and their 95% confidence intervals standardized to the total abundance.