Gå til hovedinnhold
Havforskningsinstituttet
HI
English
<- Tilbake
Søk
Søk
Søk
View page in English
Figur
Fra rapporten:
Survey of Iceland scallop beds north of Svalbard
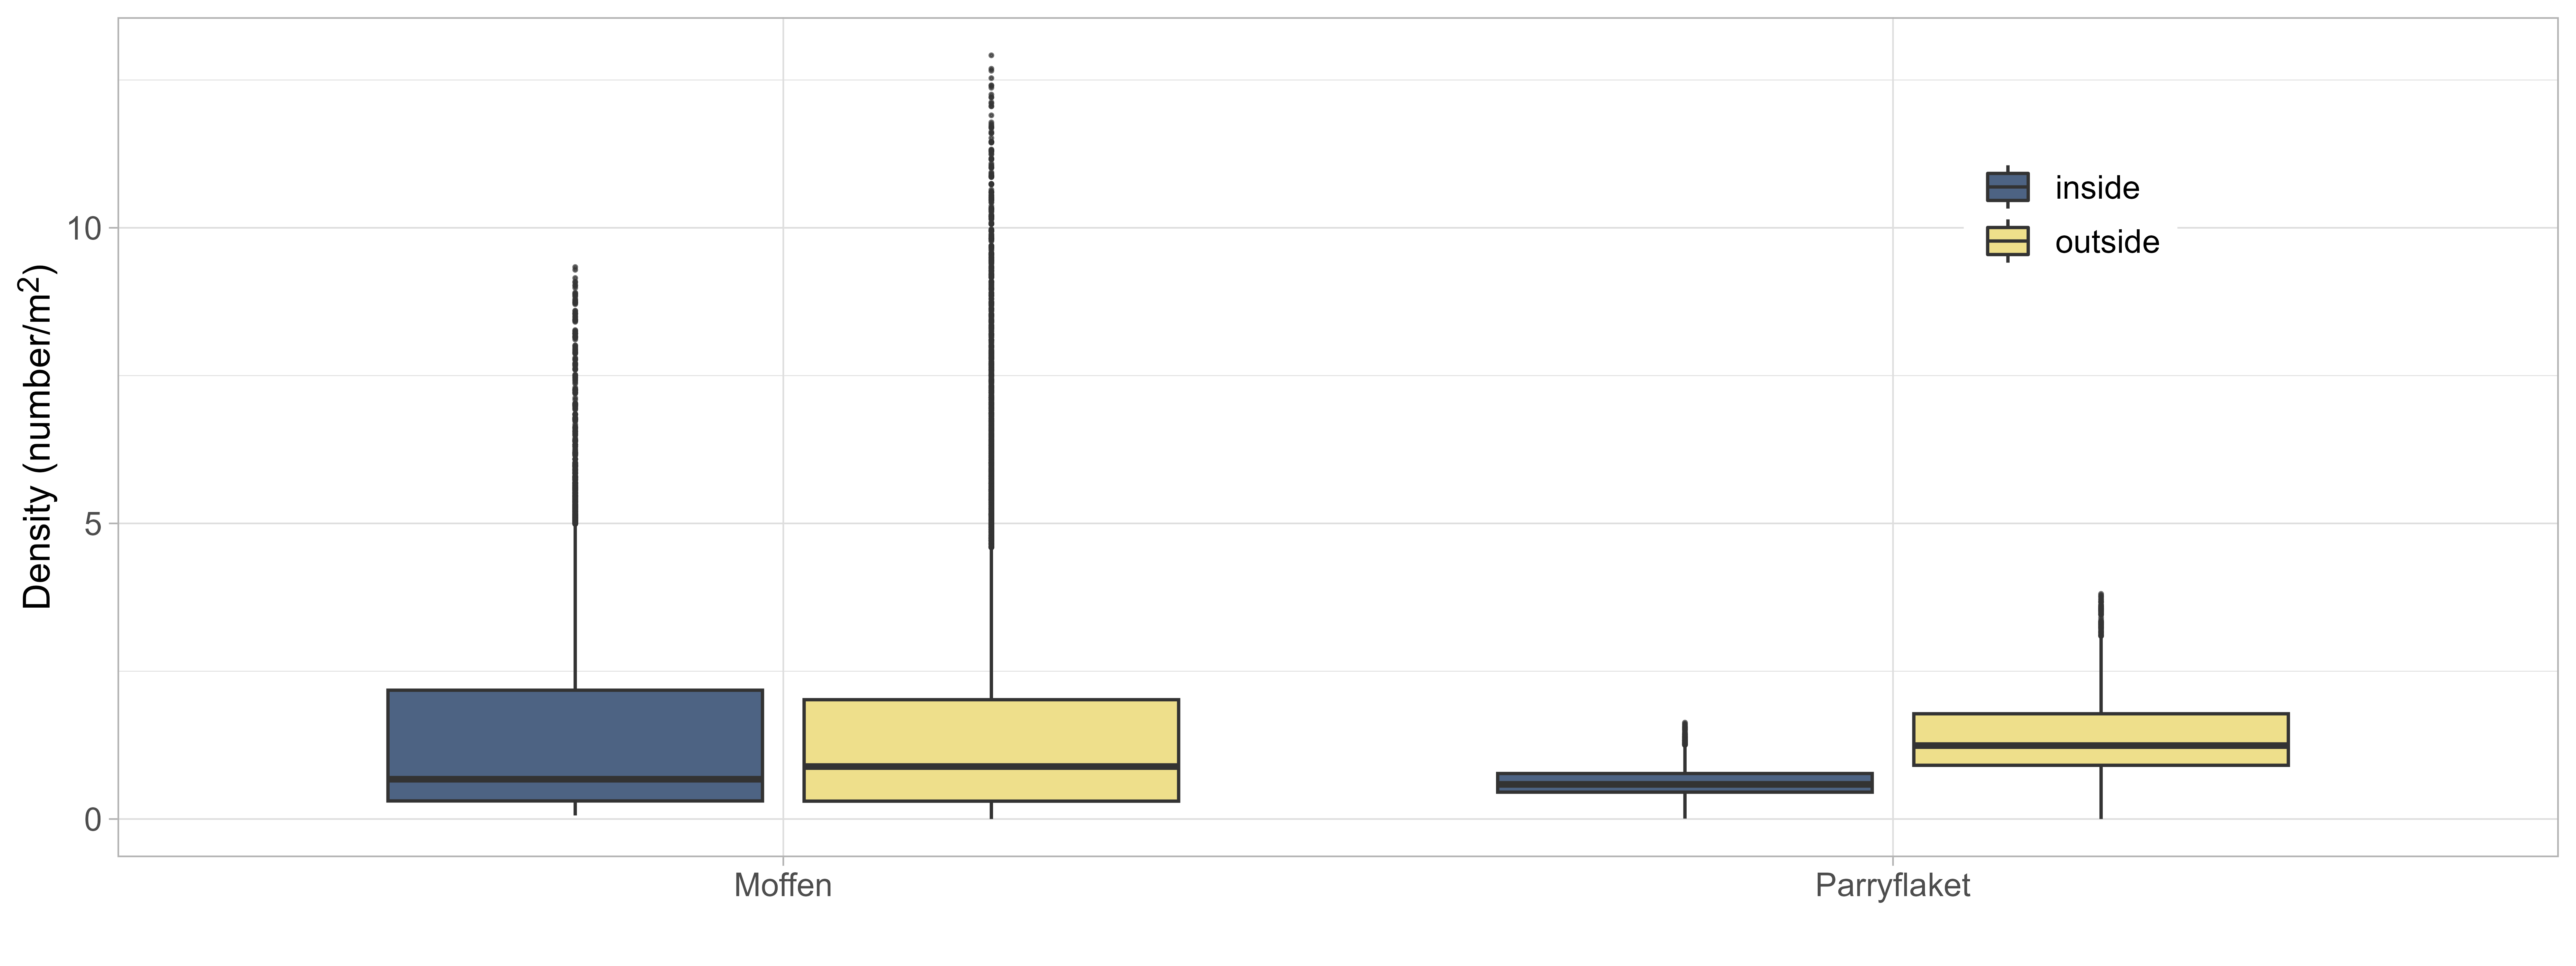
Figure 7: Scallop densities predicted by GAMM inside and outside of protected areas on Moffen and Parryflaket beds. Boxplots show median (solid lines), 25% and 75% percentiles (boxes), 1.5 interquartile range (whiskers), and outliers (dots).