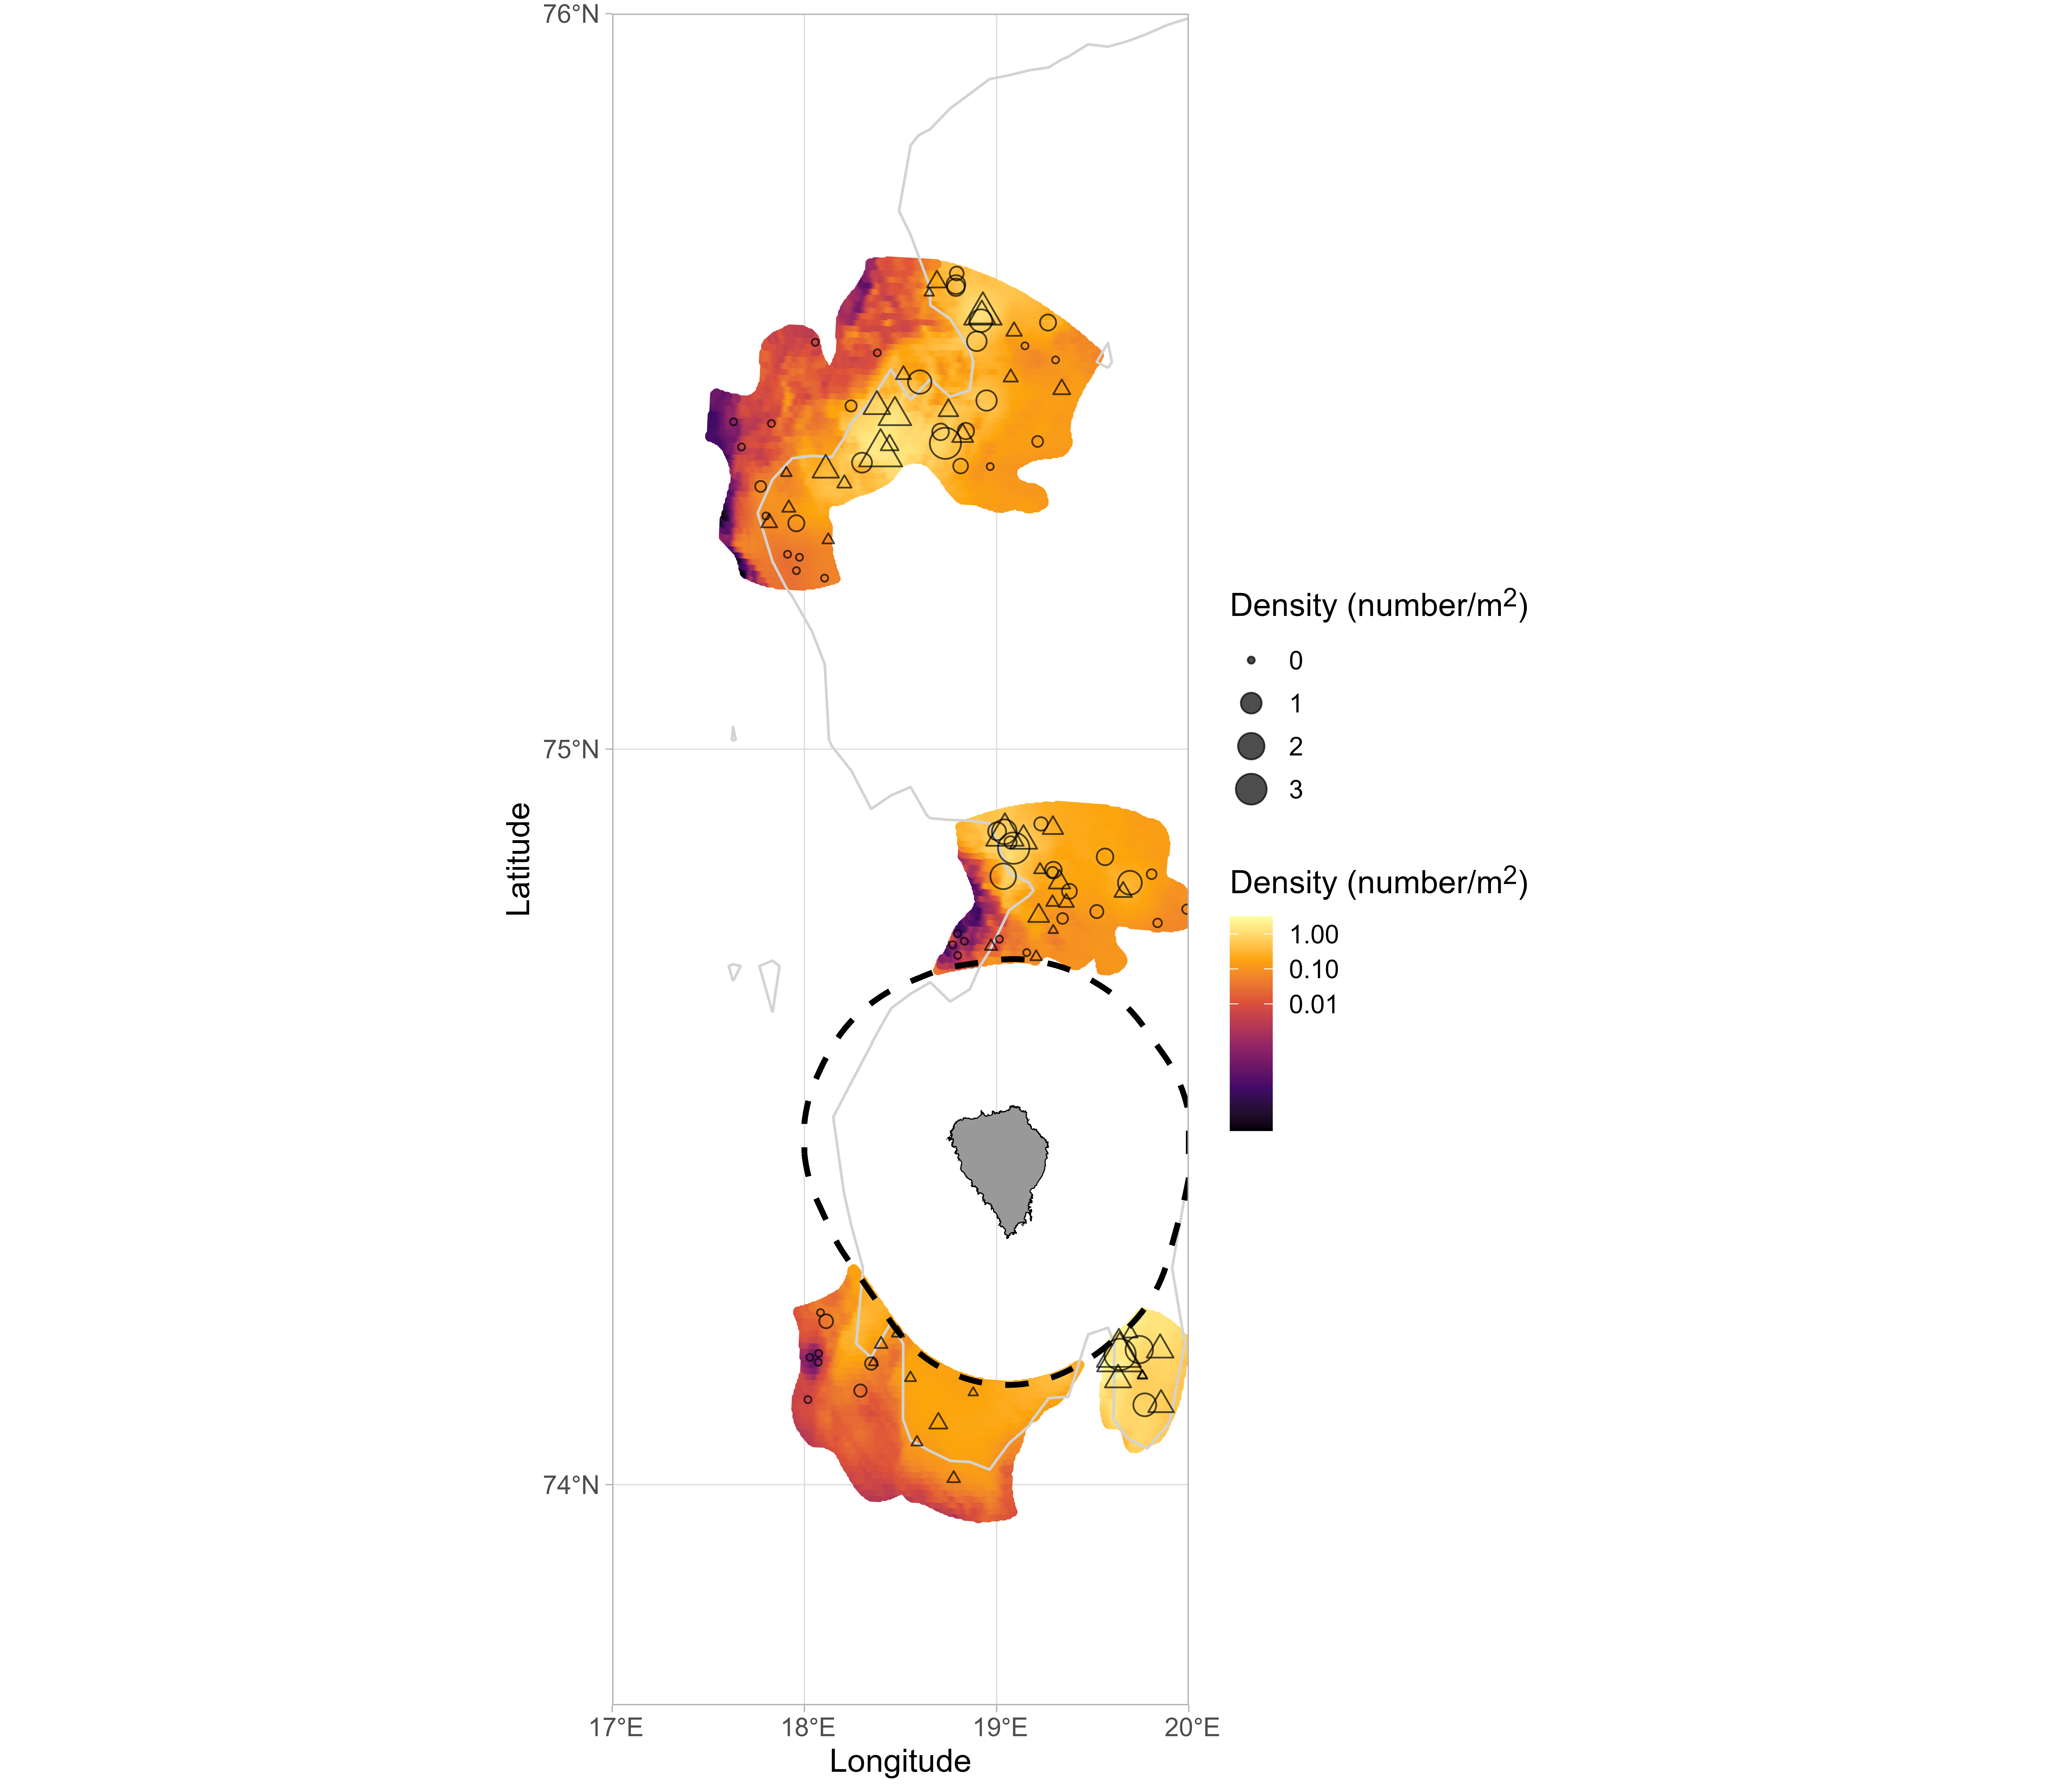
Figure 22: Density of scallops in Bear Island area (Concordia, Kveitehola and Bear Island SE scallop beds, from north to south). Shown are observed densities from video transects and dredge stations (circles with radius scaled to density) overlaid on predicted densities from spatial GAMM including weighted video and dredge observations used to estimate stock size (color scale). Land masses are indicated in grey, protected areas with dashed lines, and 100m depth contour with solid grey lines. Note that densities are on log10-scale.