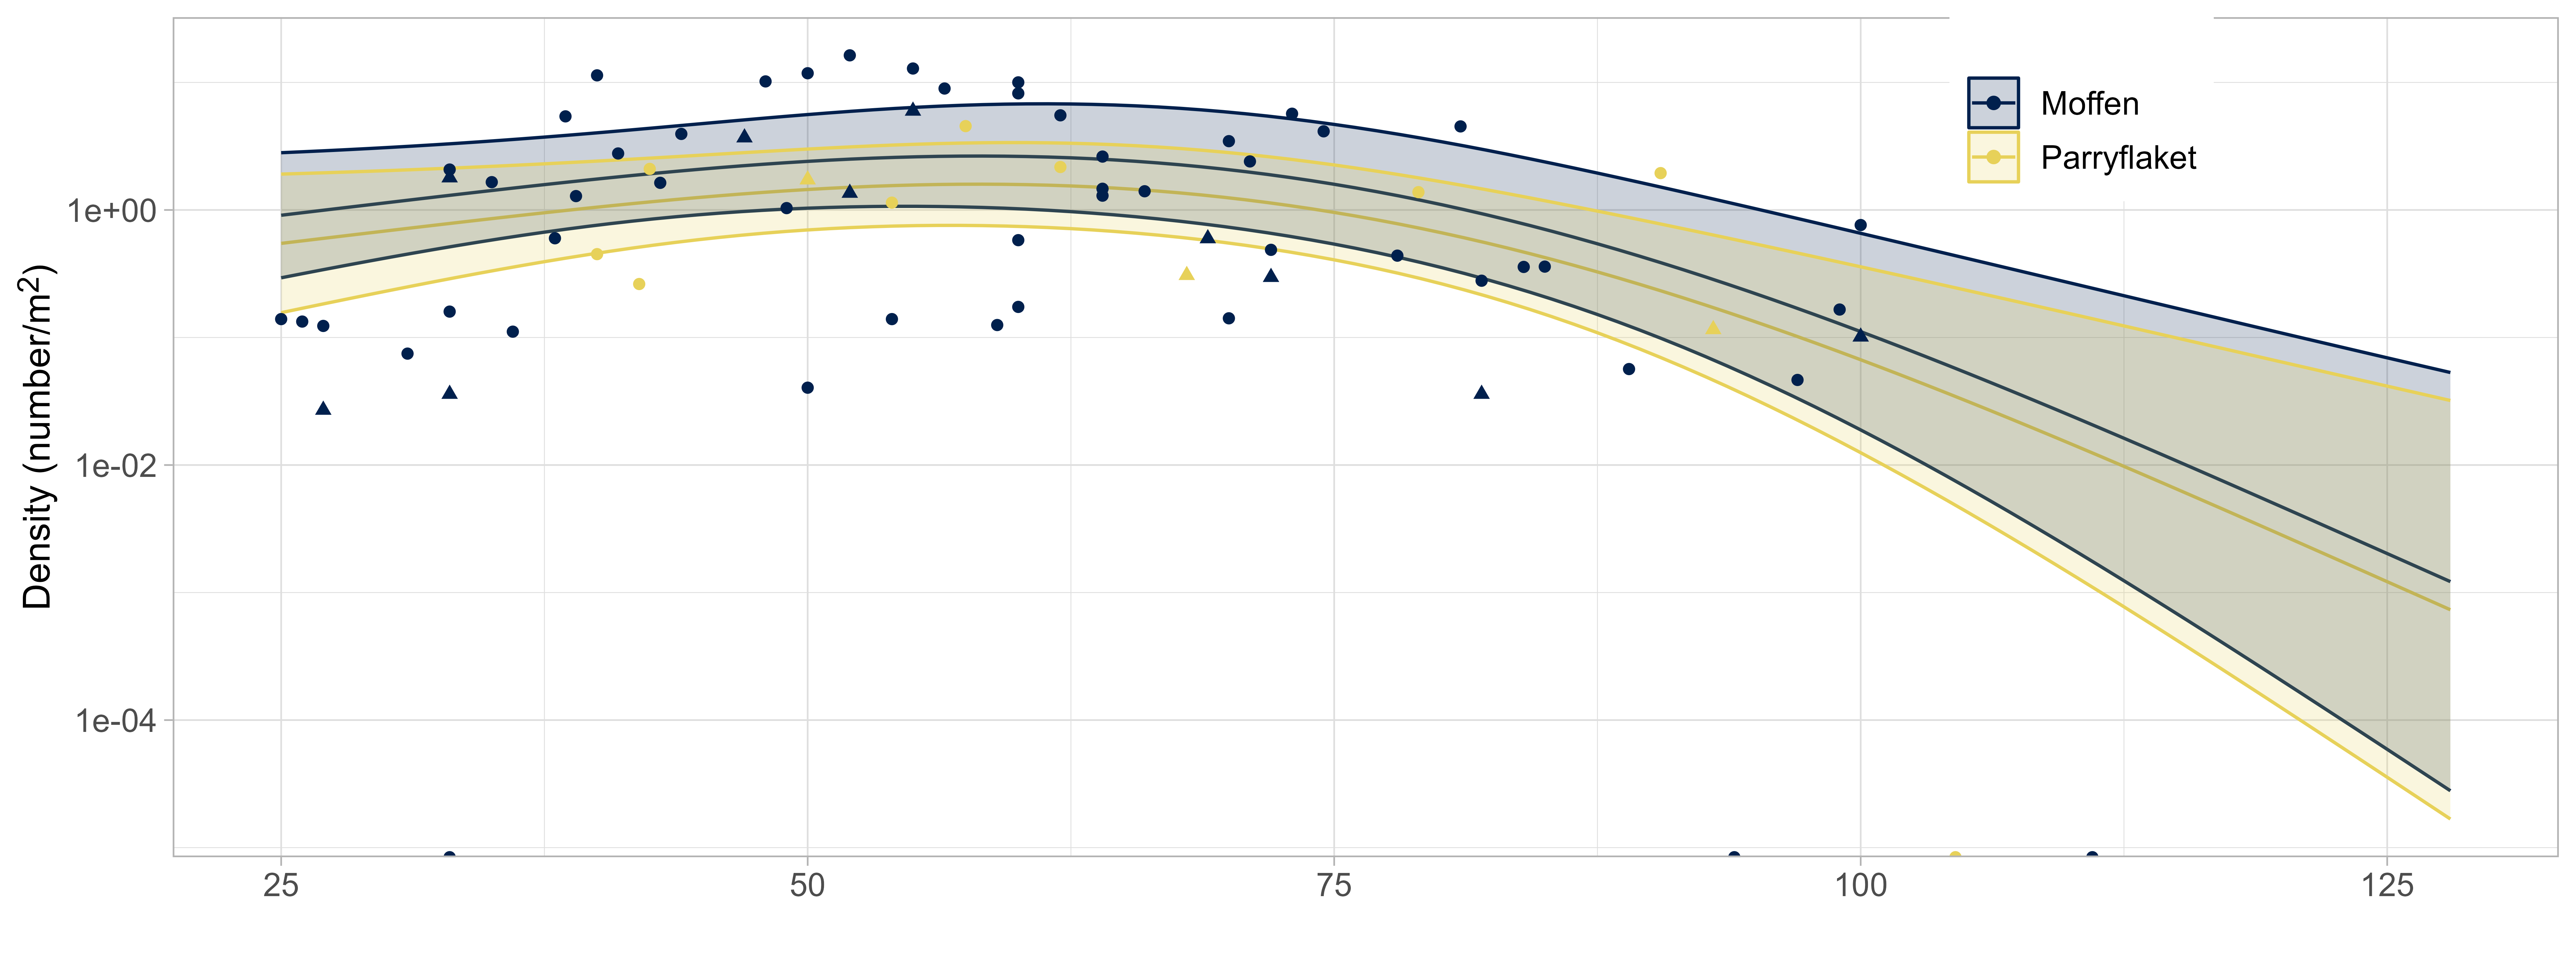
Figure 8: Relationship between scallop densities and bottom depth. Shown are observed densities on video transects (circles) and in dredges (triangles) and relationship estimated by GAMM for Moffen and Parryflaket beds. Lines represent mean estimates for a specific bottom depth and bed, polygons the corresponding 95% confidence intervals. Bottom depth corresponds to mean depth during a station or bottom depth from GEBCO bathymetric data for observations and model estimates, respectively.