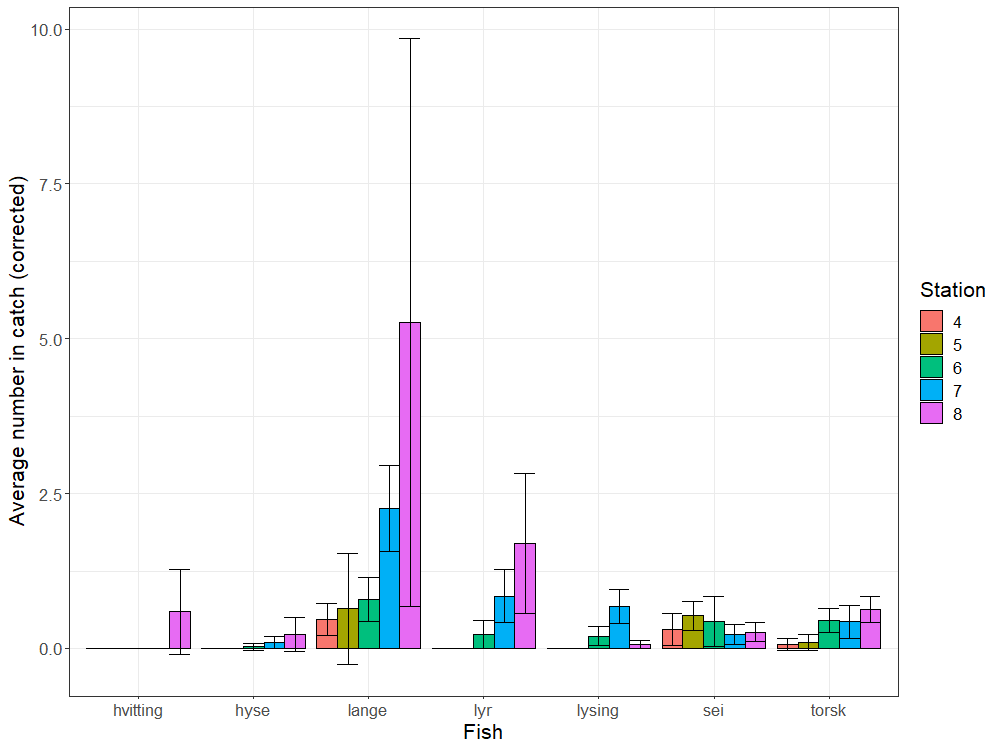
Figure 9 . Average number of the most abundant fish caught in gillnets per hour of soak time at the five stations fished during the survey (see Figure 6 ). The catch from Serial 57910 (station 5) was multiplied by three prior to averaging, as 2/3 of the link were completely twisted and unusable, resulting in a representative catch from 1/3 of the link. Standard deviations are shown by error bars.