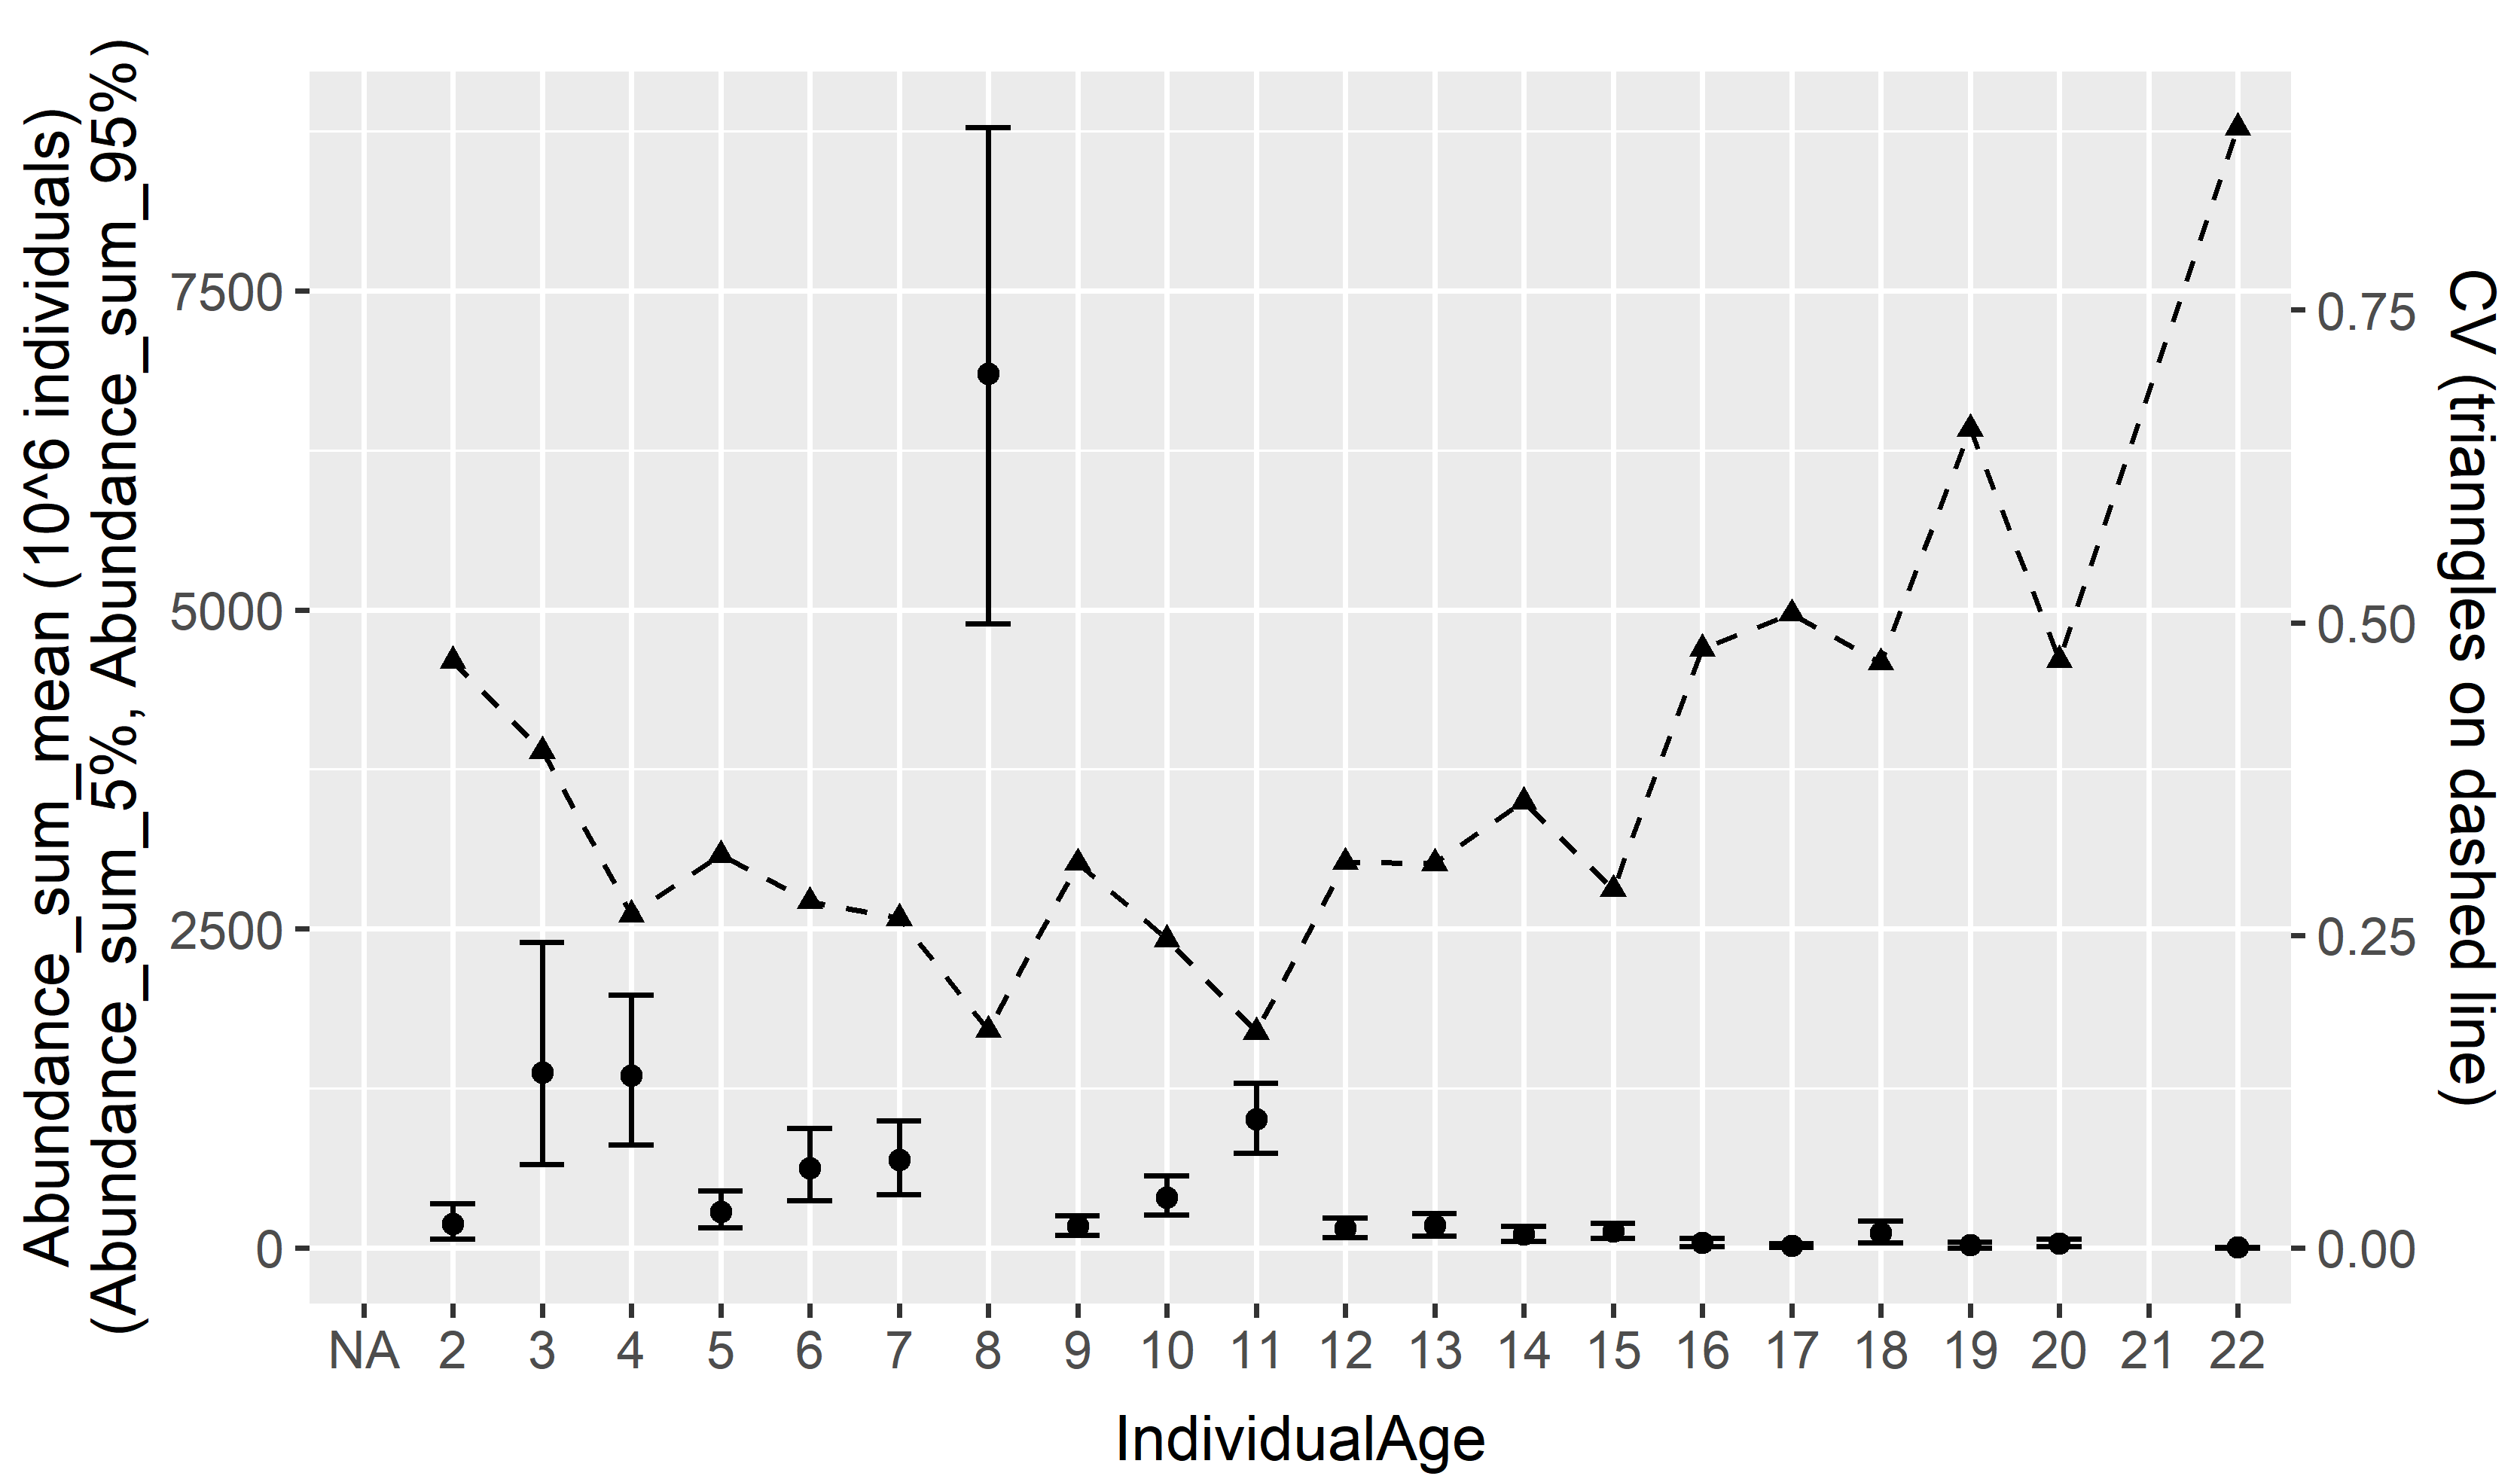
Figure 5. Abundance estimates (left axis) and relative standard error (right axis) by age from the the Norwegian spring-spawning herring spawning survey 13.-26. February 2024. Black dots are mean of 1000 boostrap replicates in Stox, error bars represent 90 % confidence intervals and triangles relative standard error (RSE).