Gå til hovedinnhold
Havforskningsinstituttet
HI
English
<- Tilbake
Søk
Søk
Søk
View page in English
Figur
Fra rapporten:
Fish investigations in the Barents Sea Winter 2024
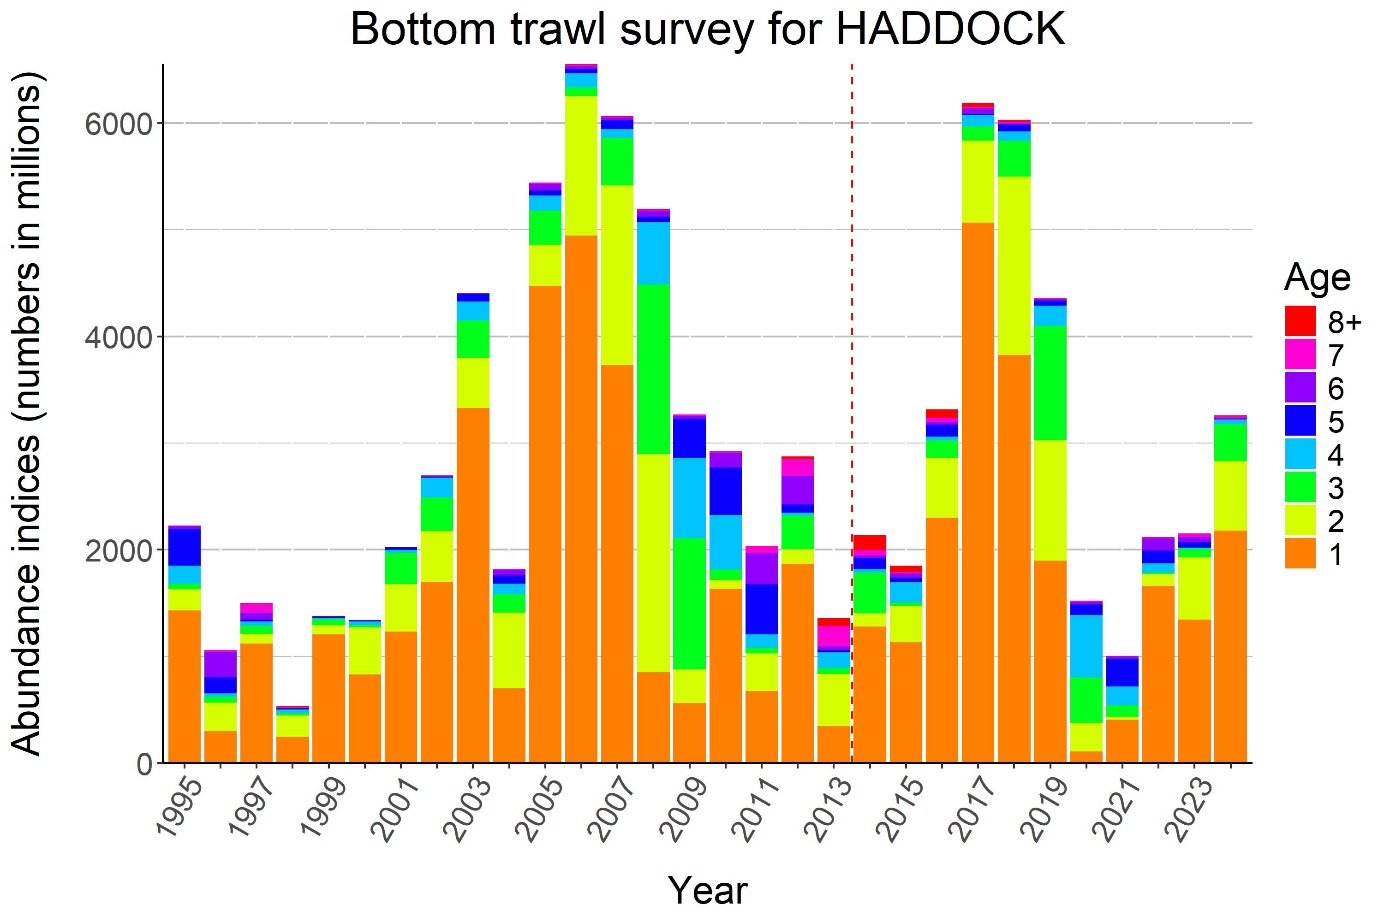
Figure 6.7. HADDOCK abundance (swept area indices) 1994-2024. The different colours represent the ages 1-9+. The dashed vertical line indicates 2014 when the survey area was extended to include main area N.