Gå til hovedinnhold
Havforskningsinstituttet
HI
English
<- Tilbake
Søk
Søk
Søk
View page in English
Figur
Fra rapporten:
Fish investigations in the Barents Sea Winter 2024
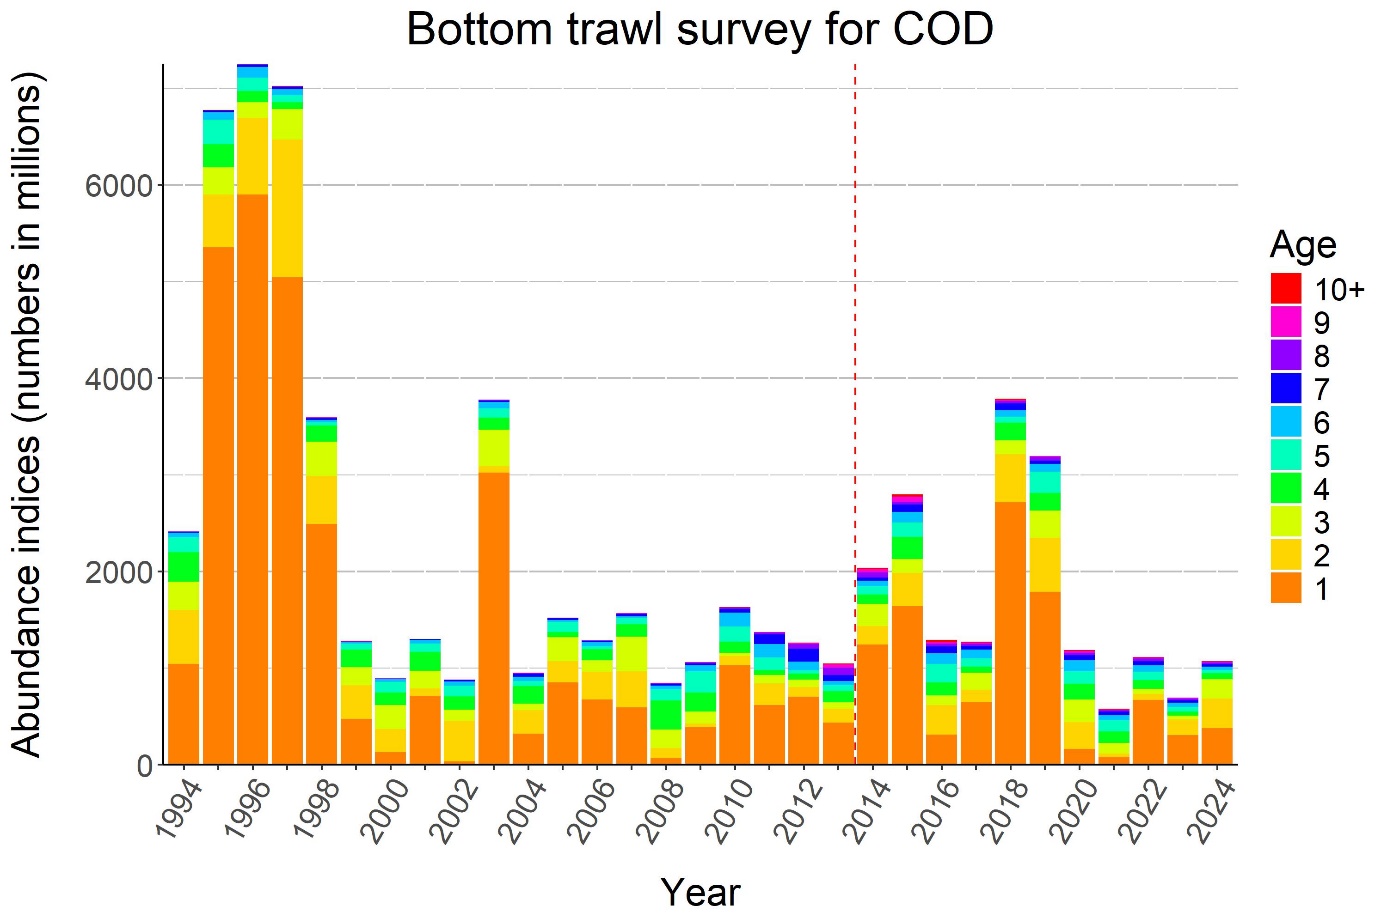
Figure 5.7. Time series of total bottom trawl abundance at age for cod (1994-2024). The dotted line separates the periods before and after the survey area was extended to include also area N.