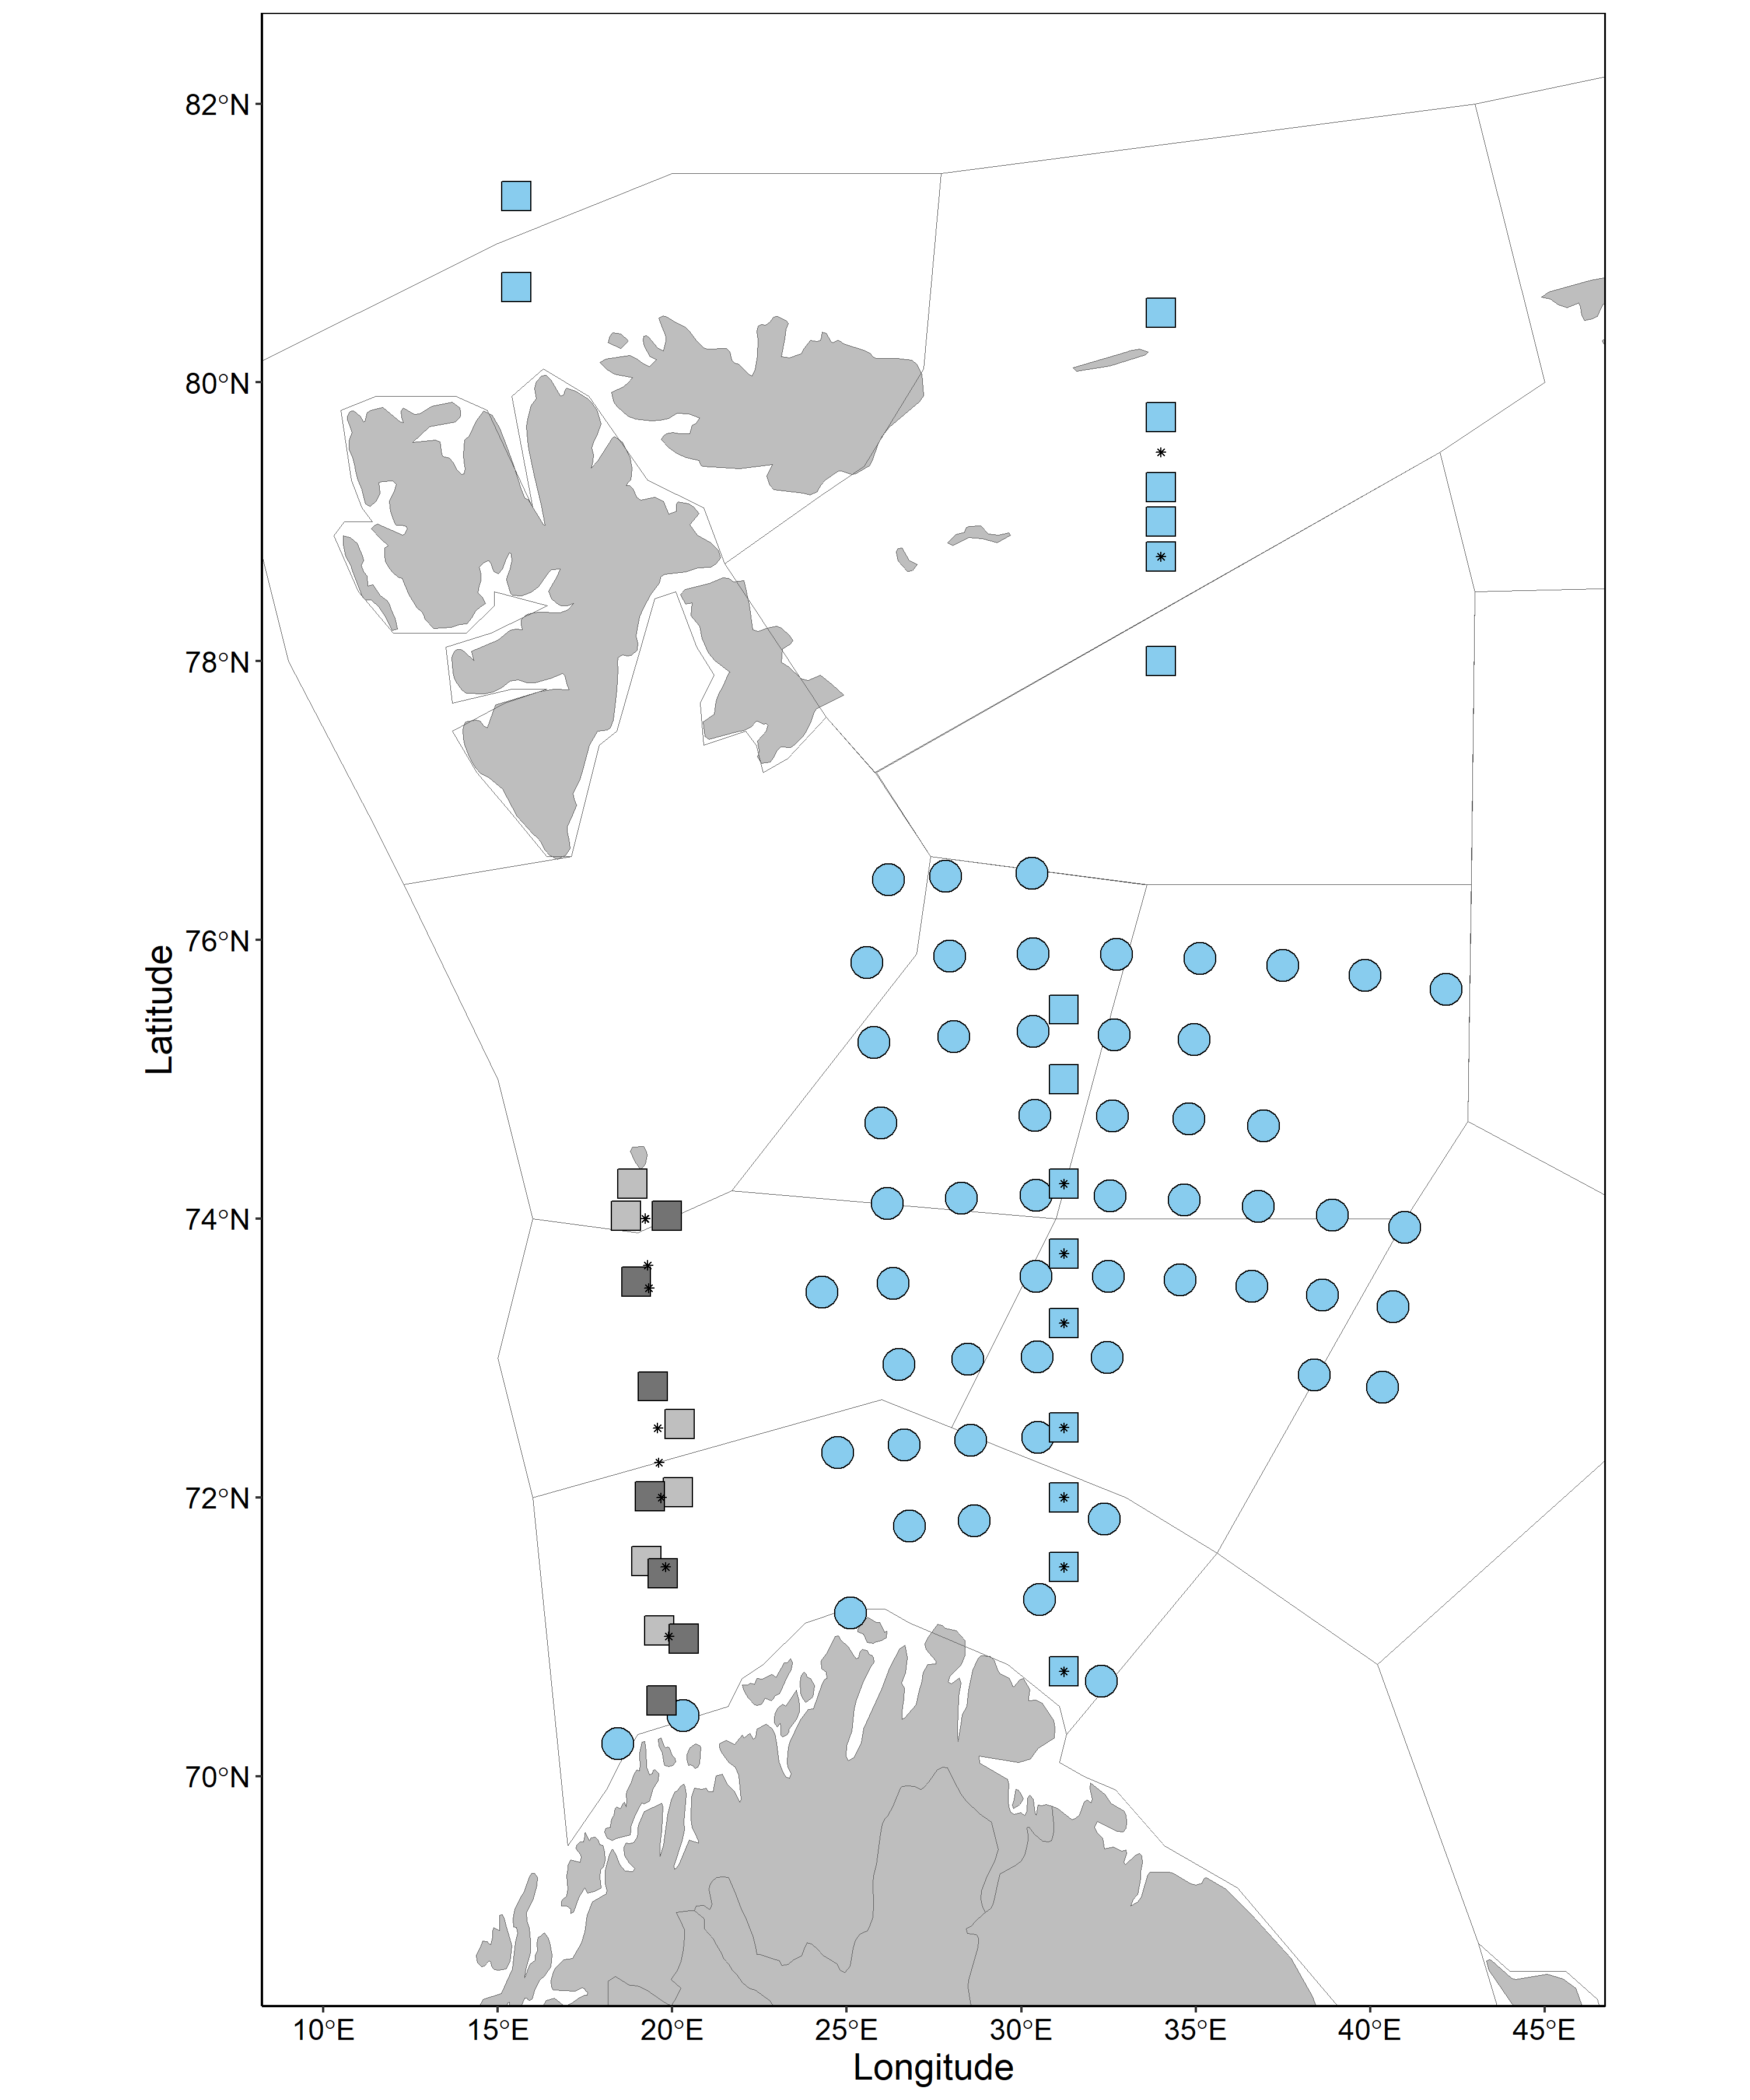
Figure 5.1.1. Map showing stations where phytoplankton samples were collected. Shapes indicate sampling activities at a given station: circle- metabarcoding sample collection, square- microscopy sample collection and analysis, star: algae-net sample collection. Color indicates the cruise when sampling occurred, blue: ecosystem, dark gray: September transect cruise, light gray: June transect cruise. Italicized labels indicate fixed sections. Outlined and labeled areas indicate Barents Sea sub-regions. Station locations along Fugløya-Bjørnøya section are shifted to reduce overlap of samples collected during separate cruises.