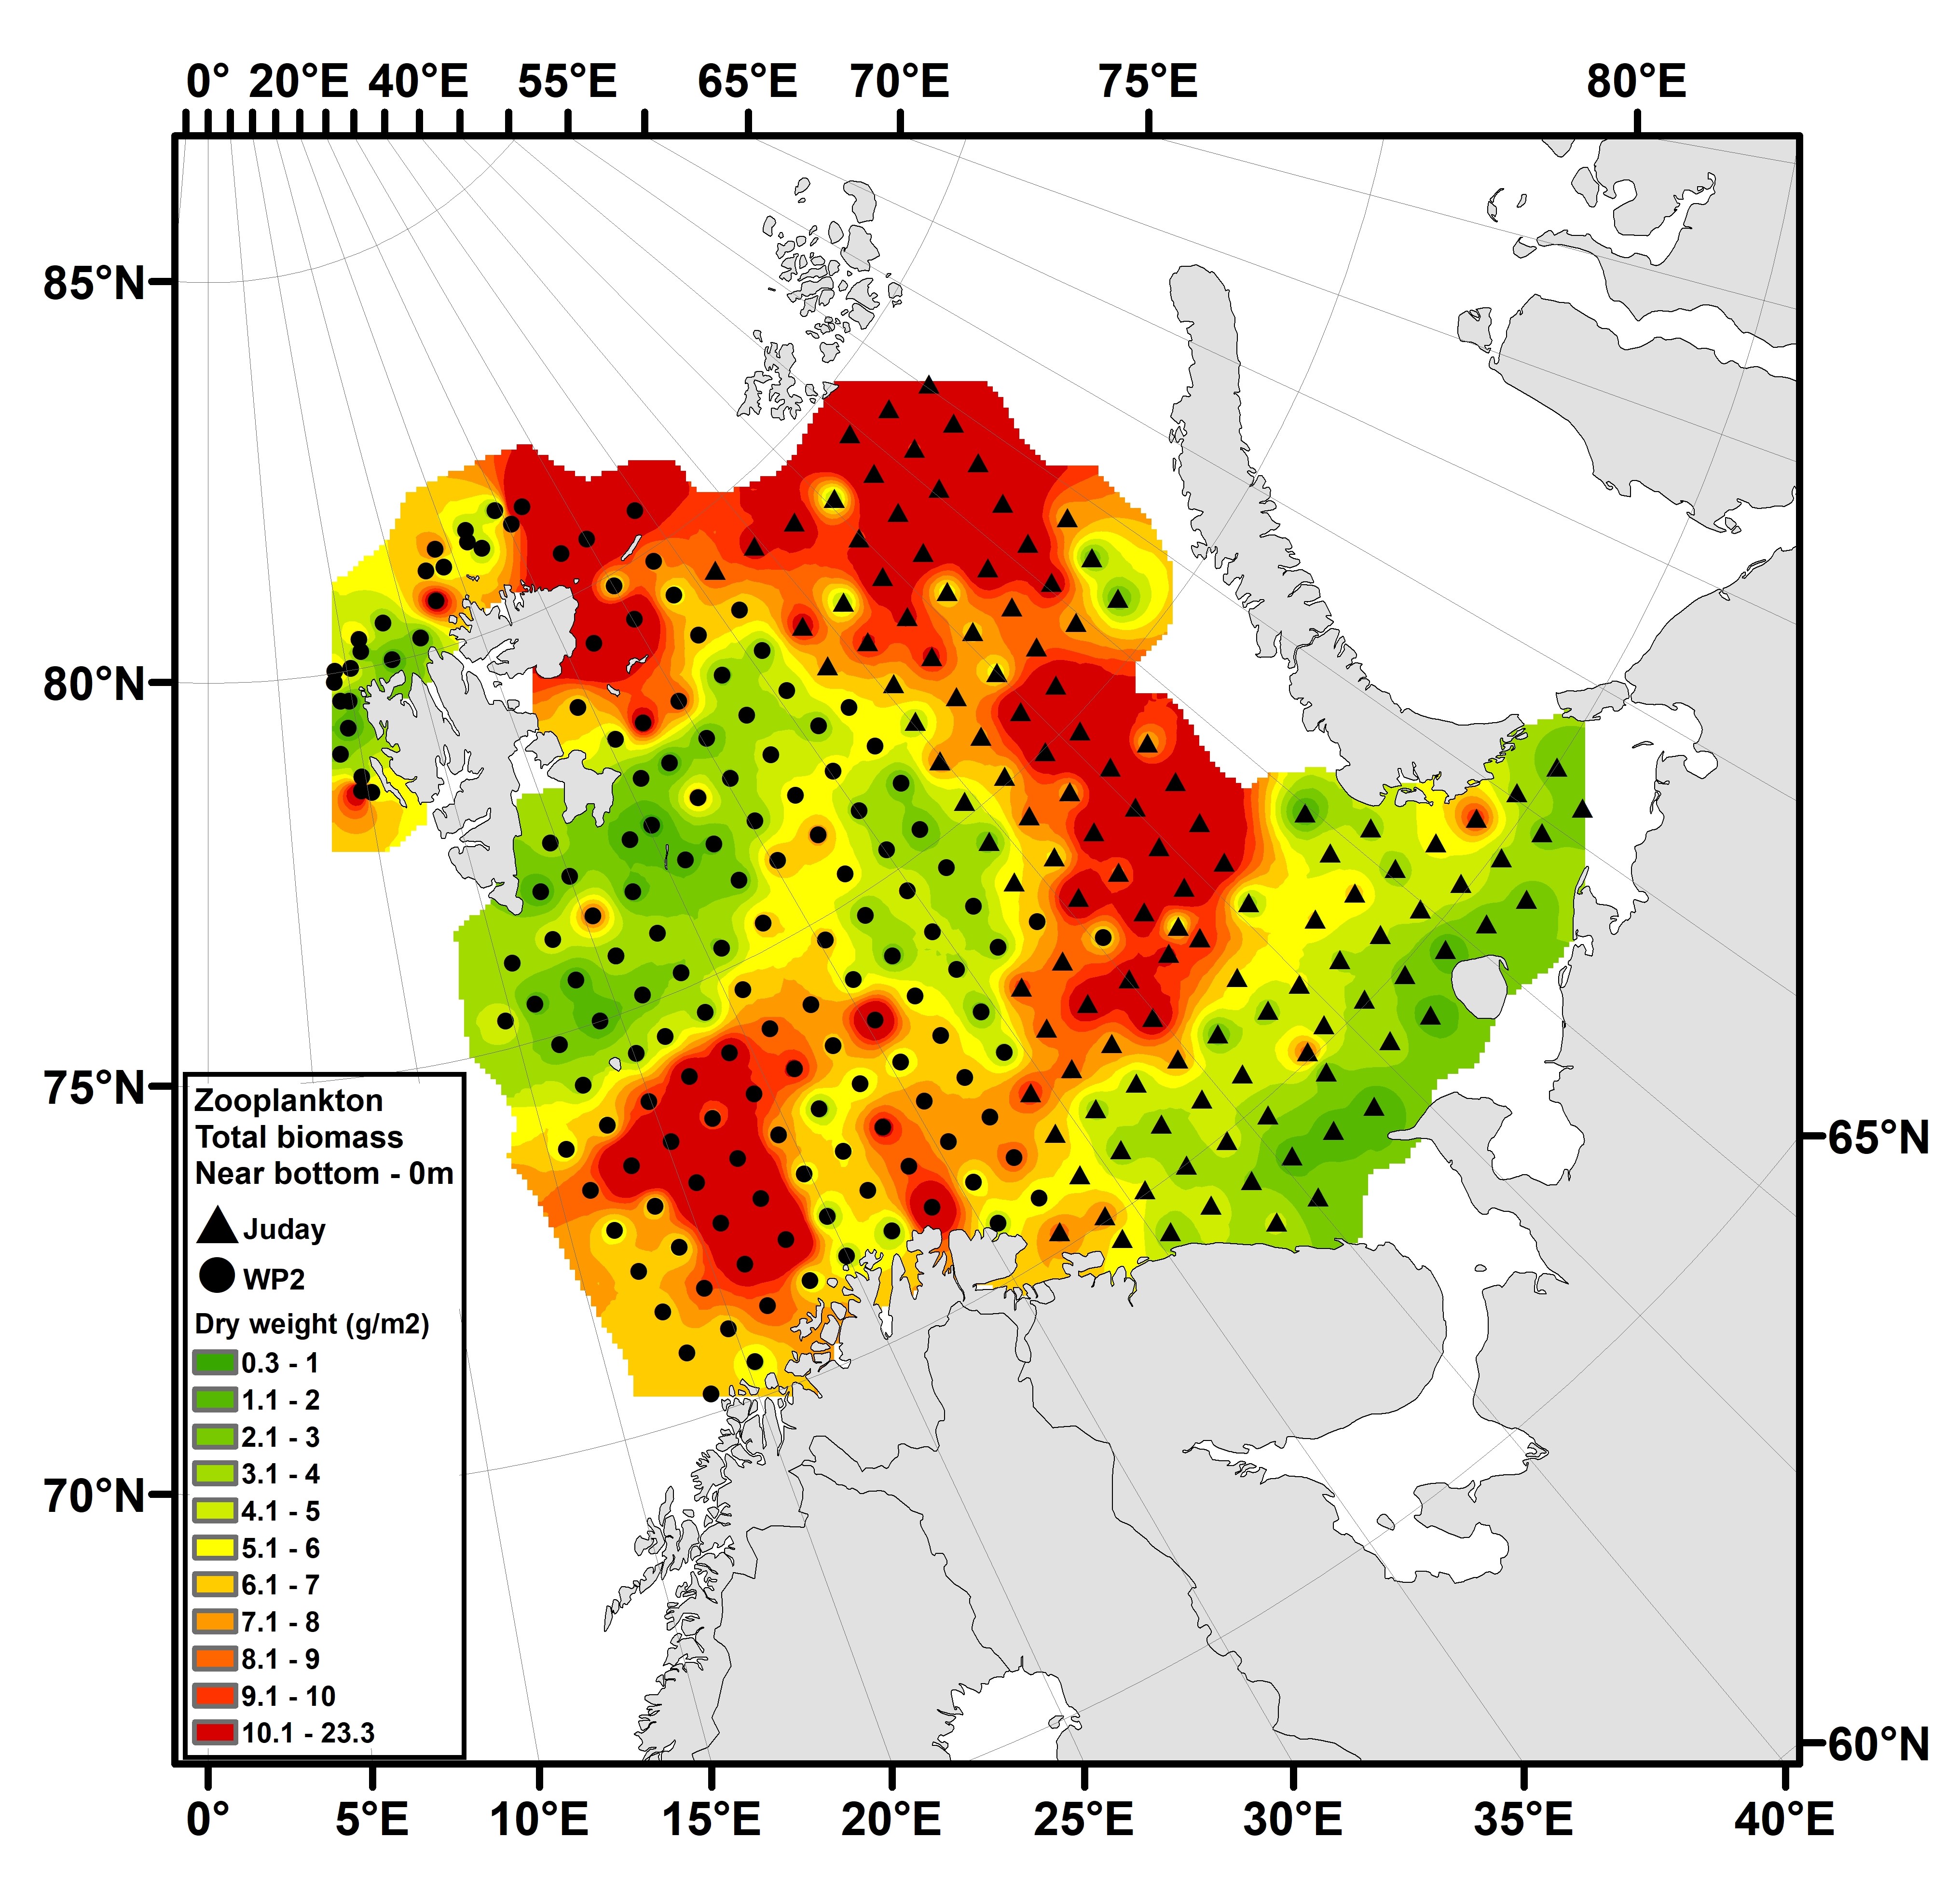
Figure 5.2.1. Distribution of total zooplankton biomass (g dry-weight m-2) from near-bottom to surface in the Barents Sea during BESS 2024 – based on a total of 293 stations. The data visualized were collected by WP2 and Juday nets with mesh-size 180 μm. Interpolation was made in ArcGIS v.10.8, module Spatial Analyst, using inverse distance weighting (IDW).