Gå til hovedinnhold
Havforskningsinstituttet
HI
English
<- Tilbake
Søk
Søk
Søk
View page in English
Figur
Fra rapporten:
Scientific report from the Norwegian and Russian Barents Sea ecosystem surveys in August-October 2024 (BESS)
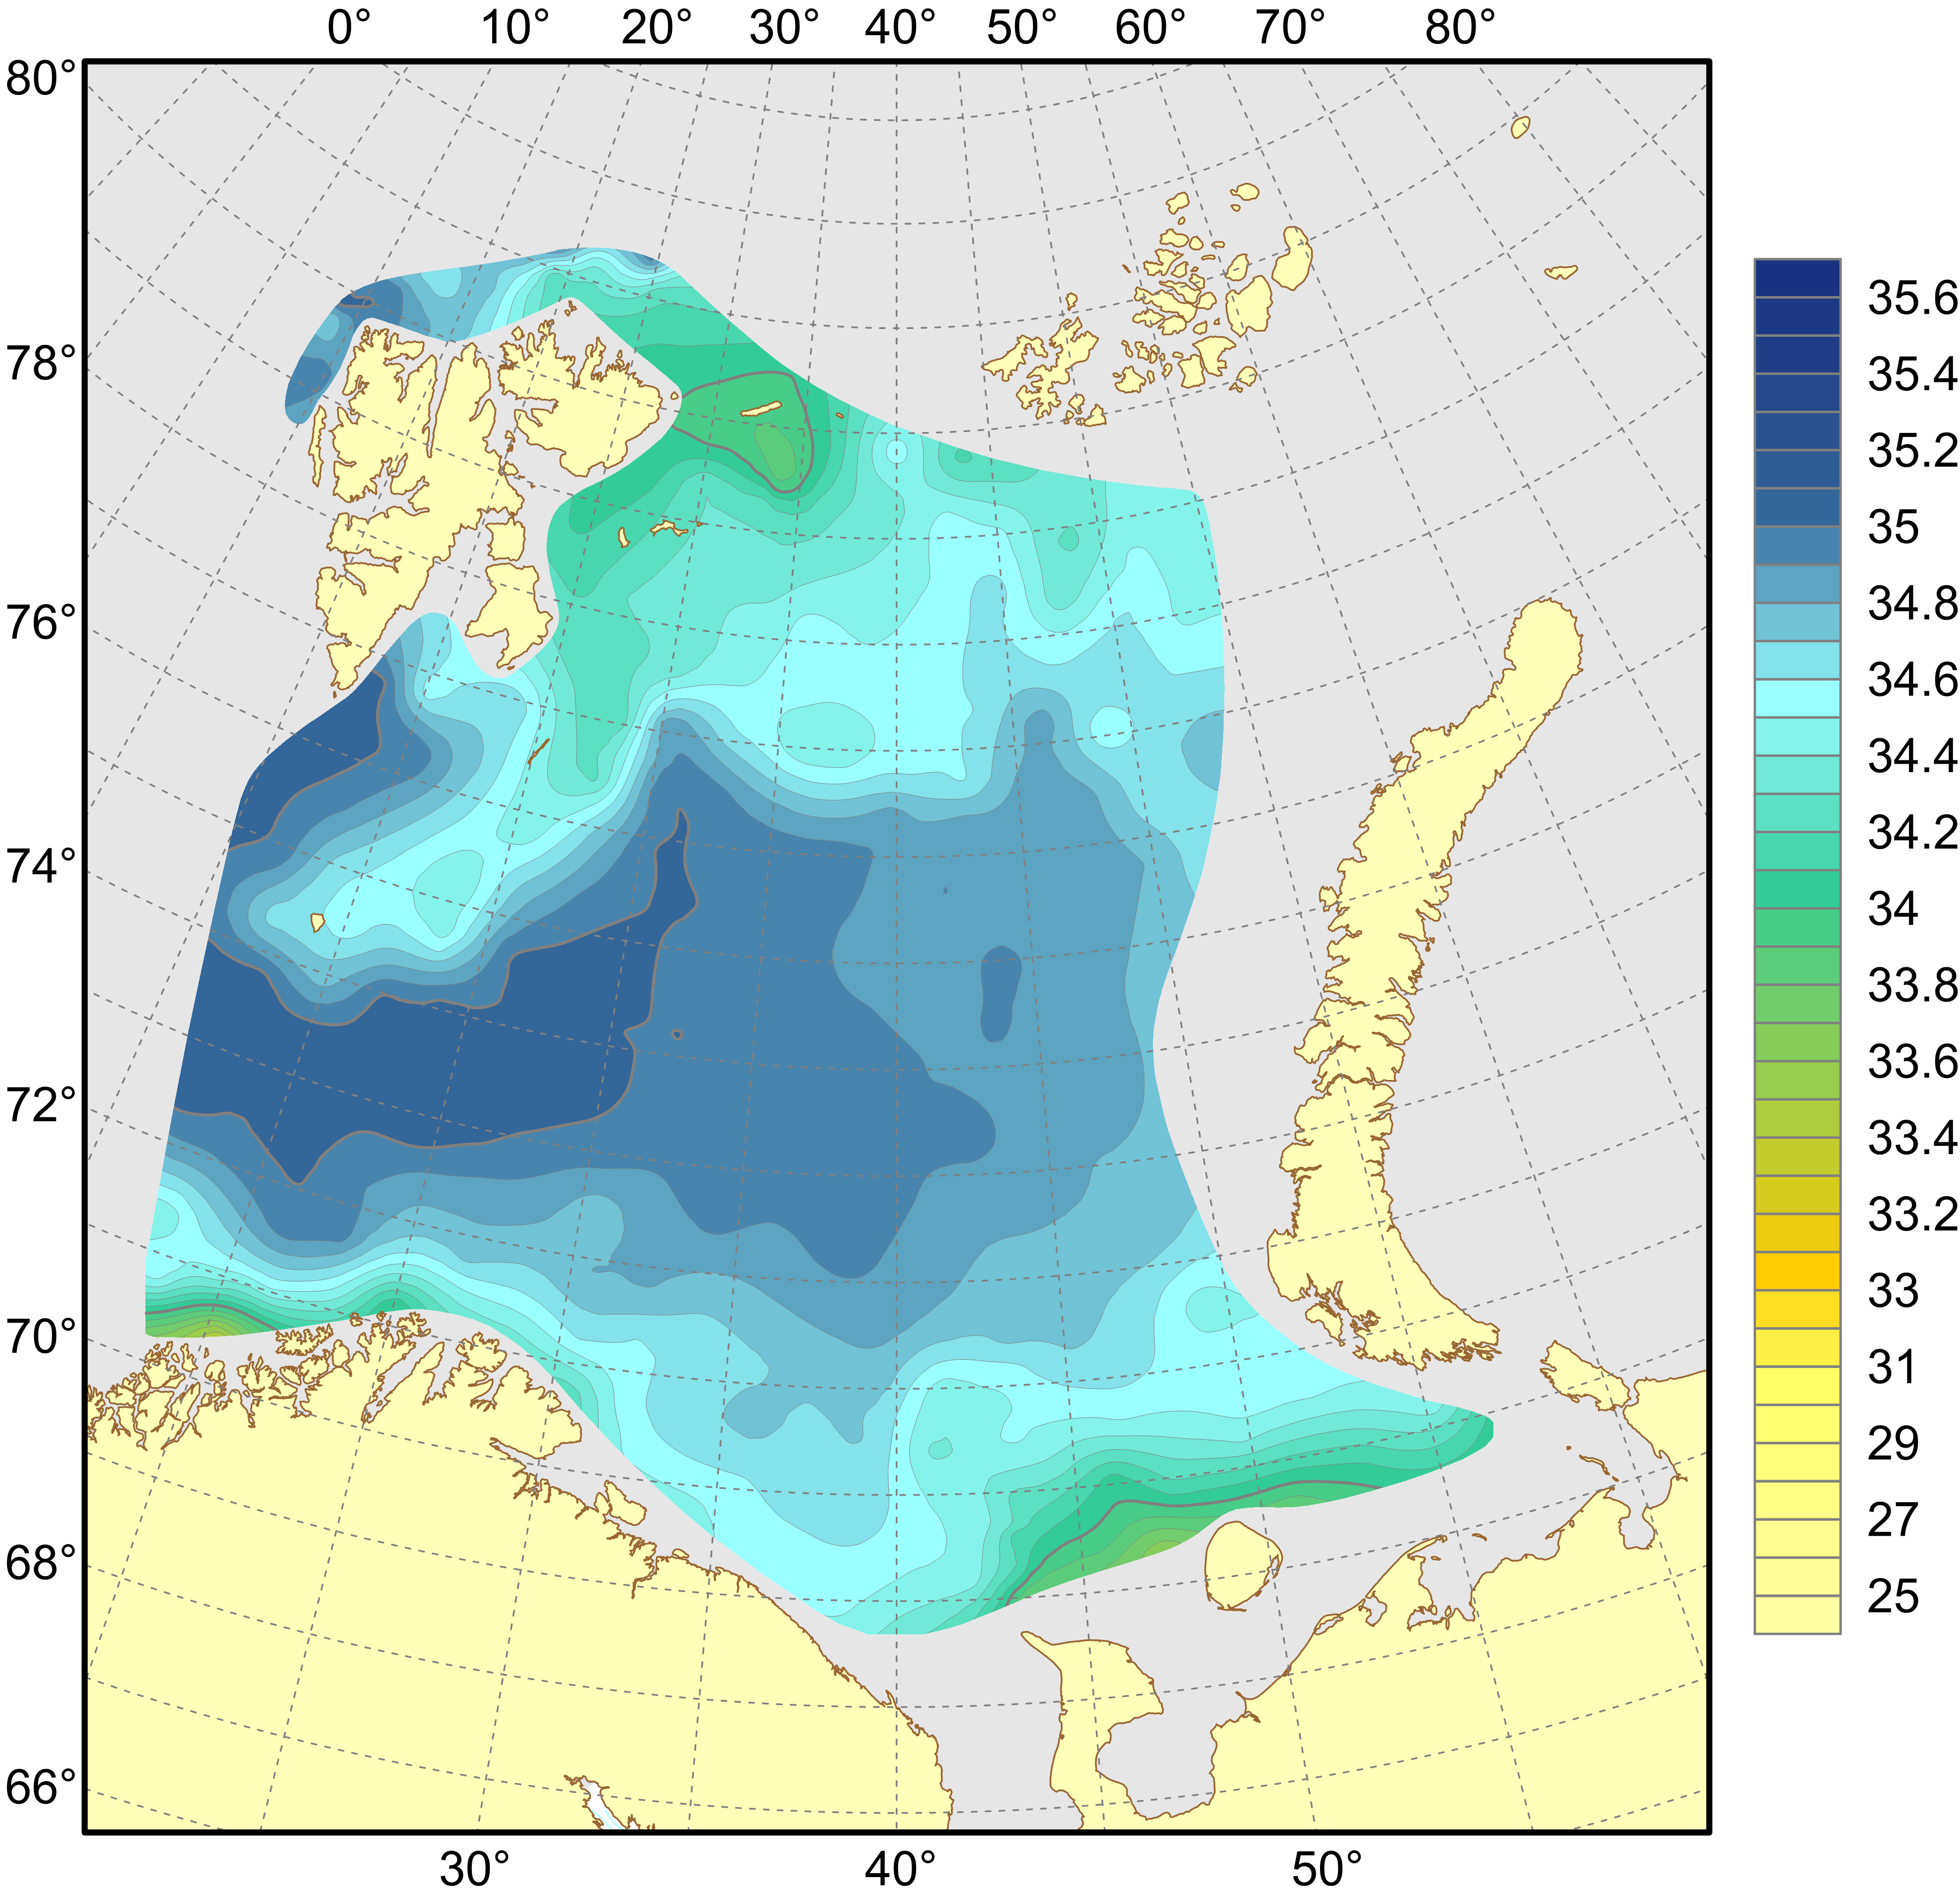
Figure 4.1.1.4. Distribution of salinity at the 50 m depth, August–October 2024.