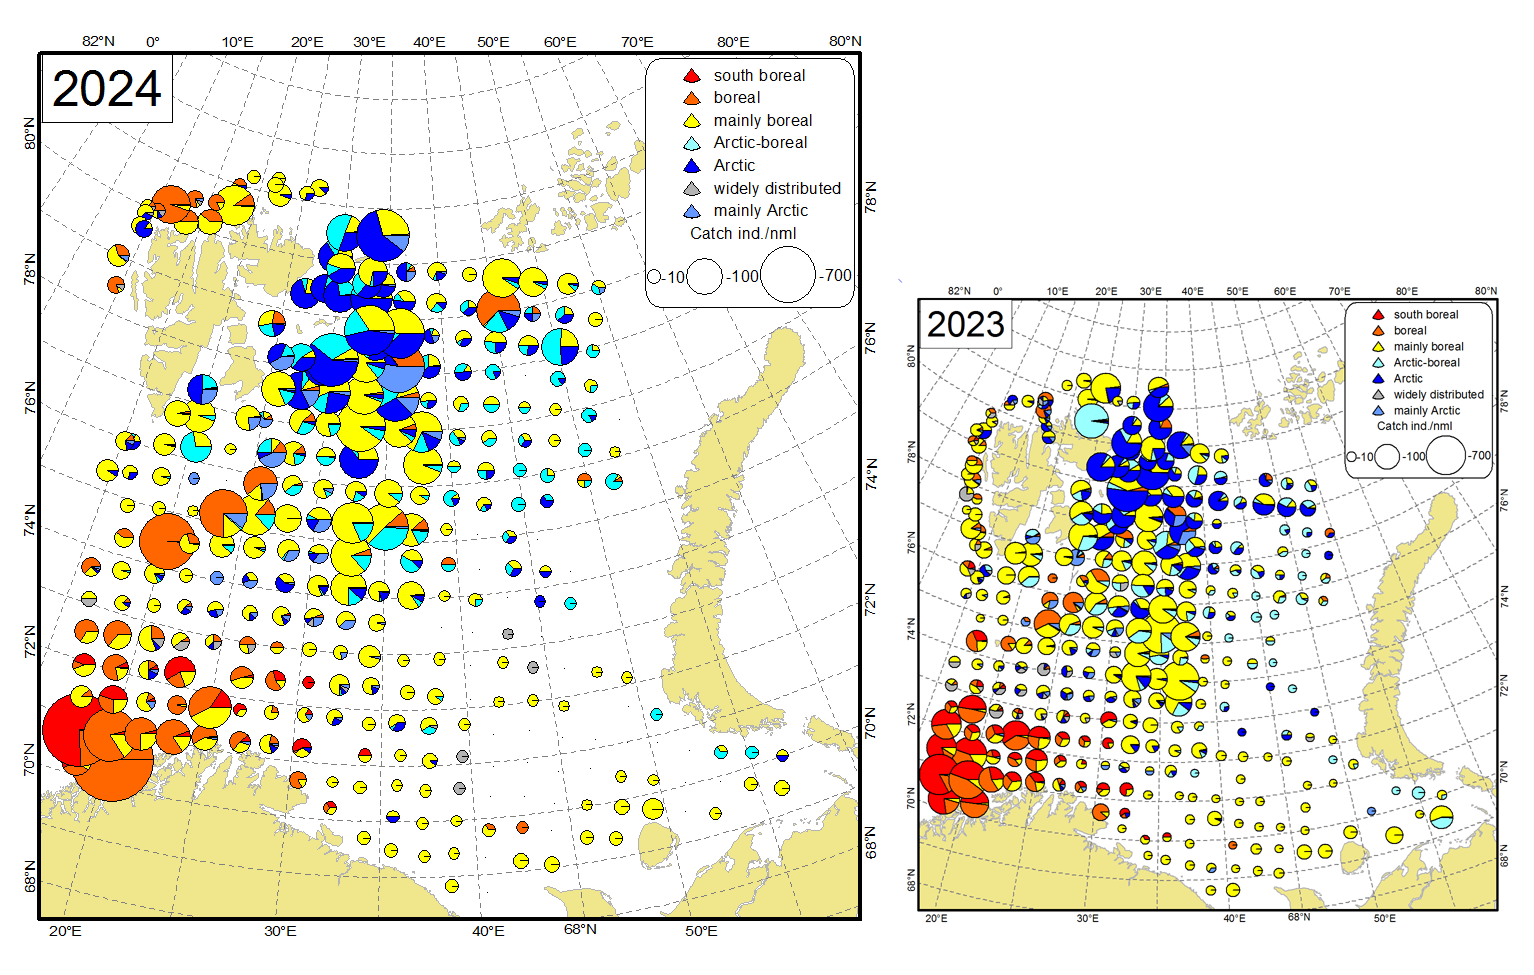
Figure 9.4.1 Distribution of non-commercial fish species from different zoogeographic groups during the ecosystem survey 2024 and 2023. The size of circles corresponds to total abundance (individuals per nm, only bottom trawl stations were used, both pelagic and demersal species are included).