Gå til hovedinnhold
Havforskningsinstituttet
HI
English
<- Tilbake
Søk
Søk
Søk
View page in English
Figur
Fra rapporten:
Scientific report from the Norwegian and Russian Barents Sea ecosystem surveys in August-October 2024 (BESS)
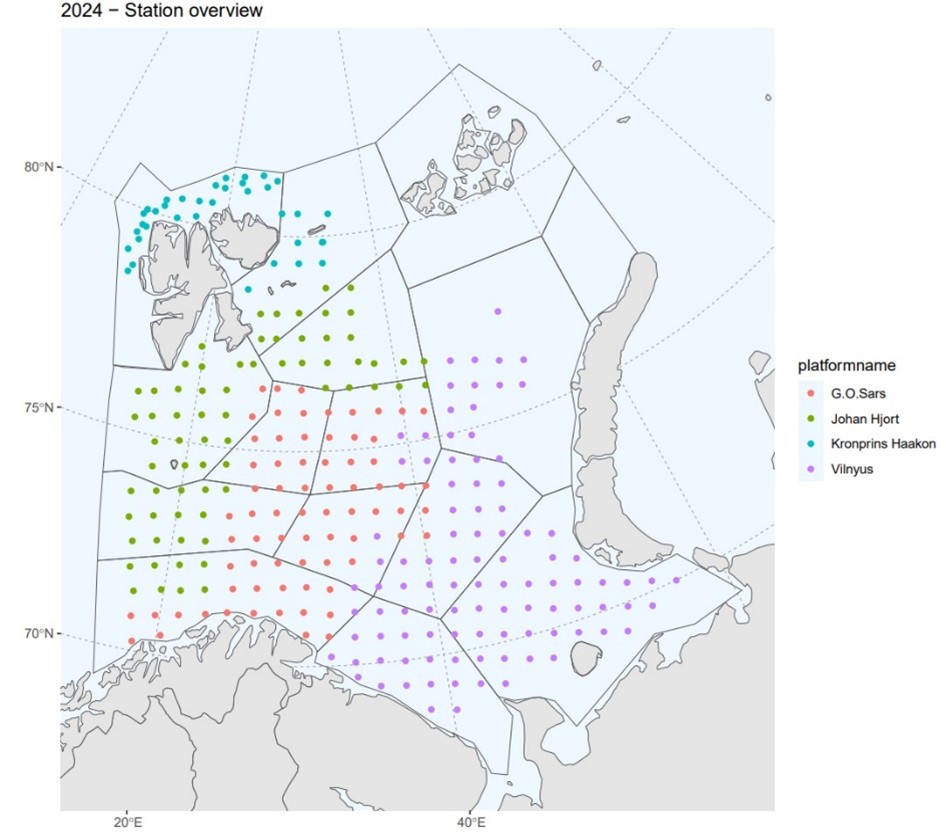
Figure 6.1. Map showing spatial coverage of the 0-group fish in the Barents Sea in 2024. Colored dots indicated vessel coverage, while grey lines 15 subareas (regions) used in estimations.