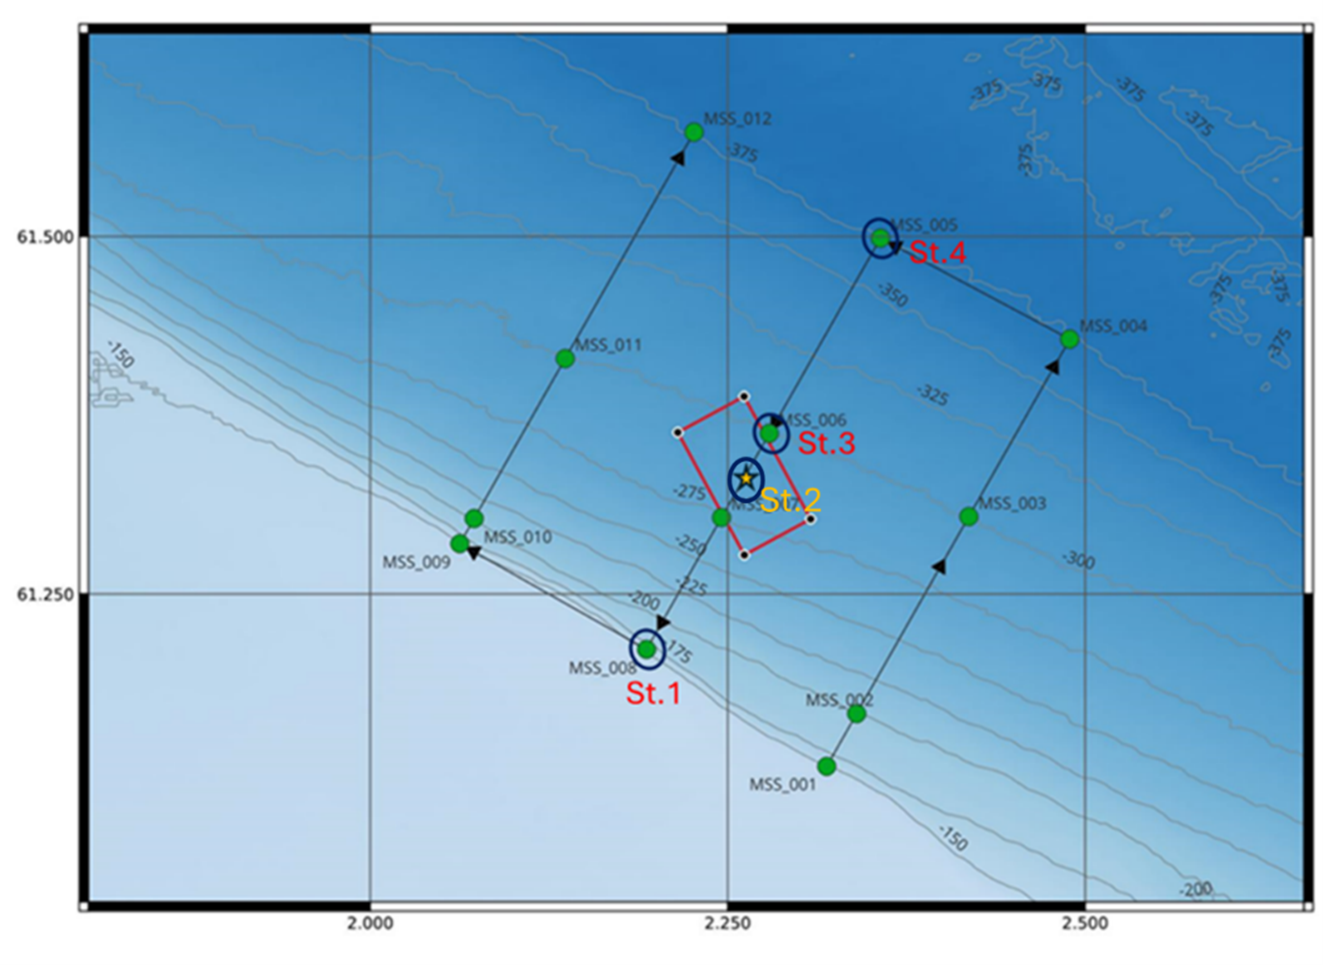
Figure 5. Figure shows the 3 planned cross shelf transect lines –holding 12 stations for MSS probe stations, CTD, nutrients, eDNA and plankton net sampling (WP2 net). Only the four stations marked with blue circles were sampled. At St. 4 and St. 2 we did not sample with the MSS probe. The red box indicates the wind farm area. See Table 1 for data sampled, and Figure 6 for CTD and nutrient results.