Gå til hovedinnhold
Havforskningsinstituttet
HI
English
<- Tilbake
Søk
Søk
Søk
View page in English
Figur
Fra rapporten:
Naturally occurring radioactive substances in fish and sediments
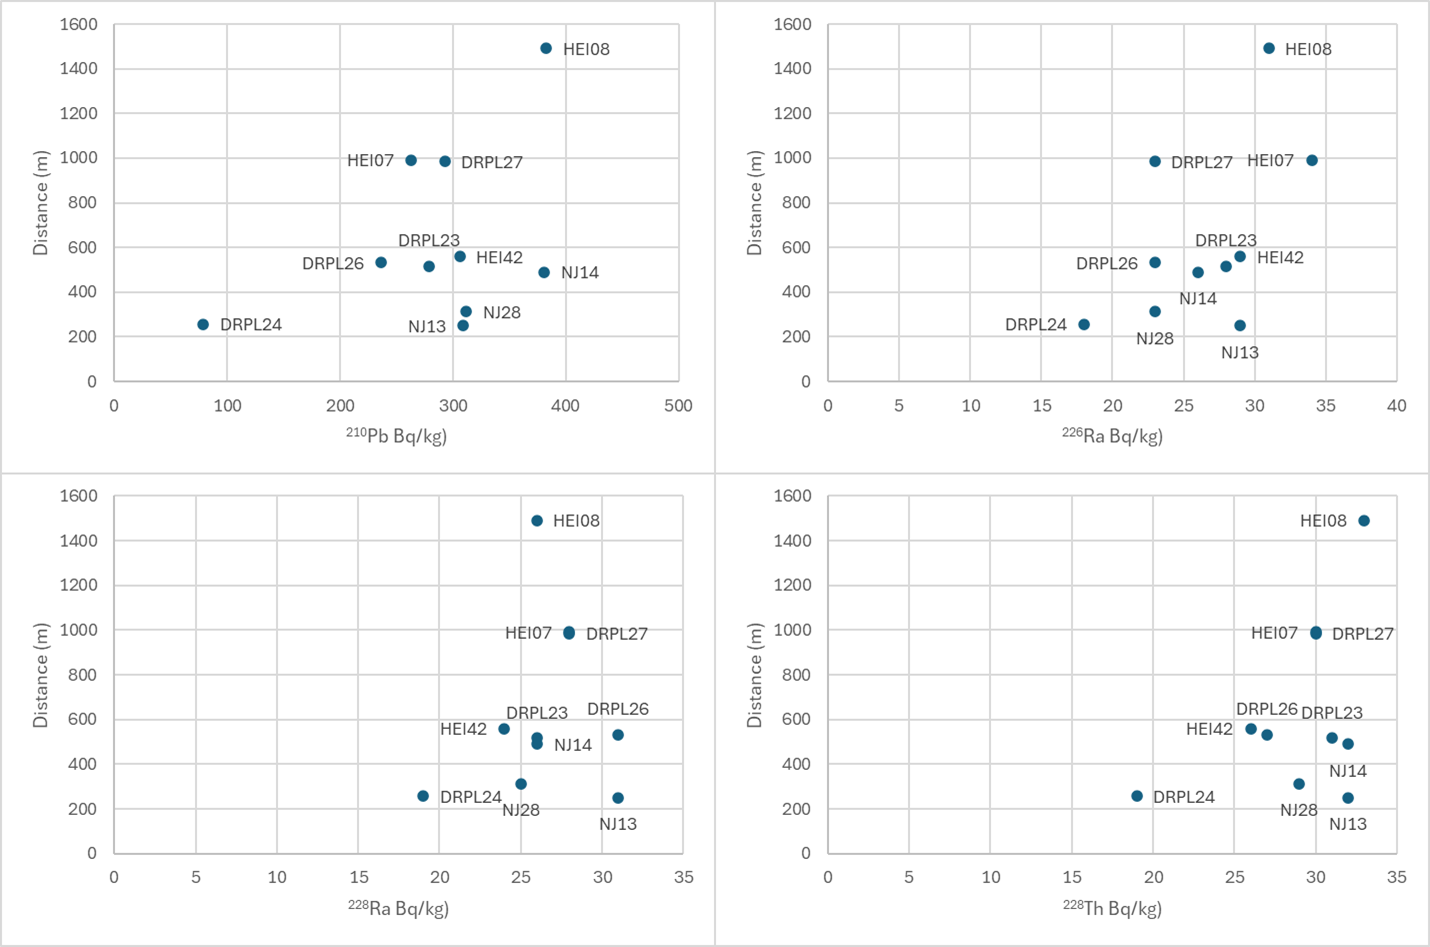
Figure 25 Activity concentrations (Bq kg-1dw) of 210Pb (upper left), 226Ra (upper right), 228Ra (lower left) and 228Th (lower right) plotted against distance to the main discharge point for the Draugen, Heidrun and Njord fields in Region VI.