Naturlig forekommende radioaktive stoffer i fisk og sedimenter
Resultater fra vannsøyleovervåkingen og den regionale sedimentovervåkingen 2024
Denne rapporten presenterer funnene fra gamma-spektrometriske analyser av de naturlig forekommende radionuklidene 210Pb, 226Ra, 228Ra og 228Th i muskel og bein av lange (Molva molva) og brosme (Brosme brosme) samlet inn ved Hywind, Snorre A, Oseberg og Sognesjøen (kontrollstasjon) i 2024. Arbeidet er en del av vannsøyleovervåkingen. Aktivitetskonsentrasjonene av alle radionuklider i alle prøver var under deteksjonsgrensene, noe som indikerer at en potensiell helsefare for konsumenter av disse artene fra disse områdene er neglisjerbar med hensyn til 210Pb, 226Ra, 228Ra og 228Th. For å kunne gjennomføre sammenligninger av for eksempel tidstrender, anbefaler studien å benytte alfaspektrometri for å oppnå lavere deteksjonsgrenser og mer nøyaktige resultater. Men dersom det primære målet er å dokumentere lave nivåer av disse radionuklidene i fisk og sjømat, anses gamma-spektrometri som tilstrekkelig.
Rapporten presenterer også funn fra analyser av 210Pb, 226Ra, 228Ra og 228Th i sedimenter fra Region II i Nordsjøen og Region VI i Norskehavet, som en del av den regionale sedimentovervåkingen. Aktivitetskonsentrasjonene i Region II er betydelig lavere enn i Region VI, noe som sannsynligvis skyldes at sedimentene fra Region II er klassifisert som "fin sand" (partikkelstørrelse 0.063–0.250 µm) , mens de aller fleste sedimentene fra Region VI var klassifisert som "pelitt" (partikkelstørrelse < 0.063 µm). Aktivitetskonsentrasjonene er imidlertid generelt i samsvar med andre norske data, inkludert funn fra Mareano-programmet og det nasjonale overvåkningsprogrammet "Radioactivity in the Marine Environment" (RAME). Våre resultater stemmer også overens med tidligere innsamlede data fra den regionale sedimentovervåkingen og er sammenlignbare med nivåer rapportert i nærliggende havområder. Syv sedimentkjerner fra de to regionene er datert ved hjelp av 210Pb. Studien finner ingen tydelig endring i nivåene av 226Ra, 228Ra og 228Th over tid i sedimentkjernene. Det er heller ingen tydelig gradient i aktivitetsnivåer med avstand fra utslippspunkt. Dette kan skyldes at produsert vann hurtigt fortynnes og spres over lange avstander i det marine miljøet. Studien anbefaler undersøkelser i Norskerenna som er et kjent sedimentasjonsområde i Nordsjøen.
Resultatene viser at det er viktig å se aktivitetskonsentrasjoner av radionuklider i sammeneng med kornstørrelse og innhold av totalt organisk karbon (TOC) i prøven. Innsamling og analyse av sandige sedimenter gir begrenset informasjon. Vi anbefaler en mer målrettet sedimentprøvetaking med fokus på leirholdige sedimentområder nær utslippspunkt. Videre anbefaler vi å bruke mer egnet prøvetakingsmateriale for innsamling av sedimentkjerner. Dette vil gi bedre 210Pb-dateringer.
Summary
This report presents the findings from gamma spectrometric analyses of the naturally occurring radionuclides 210Pb, 226Ra, 228Ra and 228Th in muscle and bone of ling (Molva molva) and cusc (Brosme brosme) collected at Hywind, Snorre A, Oseberg and Sognesjøen (a control location) in 2024. The work is part of the water column monitoring. The activity concentrations of all radionuclides across all samples were below detection limits, indicating that any potential health risk to consumers of these fish from these areas is negligible concerning 210Pb, 226Ra, 228Ra and 228Th. To enhance the robustness of comparisons and conclusions, the study recommends obtaining lower detection limits and more accurate results, preferably through alpha spectrometry. Nontheless, for the primary goal of documenting low levels of these radionuclides in fish and seafood, the gamma spectrometry method employed in this study is concidered sufficient.
The report also presents findings from analyses of 210Pb, 226Ra, 228Ra and 228Th in sediments collected in Region II in the North Sea and Region VI in the Norwegian Sea as part of the regional sediment monitoring. The activity concentrations in Region II are significantly lower than in Region VI, which most likely are due to the sediments from Region II being classified as "fine sand" (grain size 0.063-0.250 µm), while the majority of the sediments from Region VI were classified as "pelite" (grain size<0.063 µm). Nontheless, the results are consistent with other Norwegian data, including findings from the Mareano program and the national monitoring program "Radioactivity in the Marine Environment" (RAME). Our results also align with previously collected data from the regional sediment monitoring and are comparable to levels reported in adjacent sea areas. Seven sediment cores from the two regions are dated using the 210Pb-method. There are no significant temporal variations in the levels of 226Ra, 228Ra and 228Th in sediment cores, nor is there a gradient relative to discharge point distance, as discharged produced water rapidly dilutes in the marine environment. However, pollution can still be transported over long distances, as evidenced by past findings in the Norwegian Trench.
To improve the assessment of contamination levels, it's crucial to contextualize radionuclide data against sediment grain size and total organic carbon (TOC). The current sampling strategy may misrepresent pollution levels in different regions due to sandy sediments' low retention capacity for pollutants. Thus, we recommend targeted sampling campaigns focused on clay-rich sediment areas near discharge points, as well as using more suitable sampling equipment and strategies for obtaining longer sediment cores. The latter will give more reliable results from the 210Pb-dating.
1 - Introduction
The radionuclides lead-210 (210Pb) (t1/2=22.3 years), radium-226 (226Ra) (t1/2= 1 600 years) , radium-228 (228Ra) (t1/2=5.75 years) and thorium-228 (228Th) (t1/2=1.9 years) are part of the decay chains of the primordial radionuclides uran-238 (228U) and thorium-232 (232Th) and exist naturally in the marine environment.
In addition to natural sources, anthropogenic activities significantly contribute to the presence of these radionuclides in the marine environment, particularly through produced water (PW) discharges from the petroleum industry.
The integrated ecosystem management plans for Norway’s maritime areas aim to mitigate the impact of human activities on the marine environment (Norwegian Ministry of Climate and Environment, 2020). One of the primary objectives is to ensure that operational discharges from the petroleum industry should not cause levels above the background of naturally occurring substances, including radionuclides. This has not been achieved.
In the OSPAR maritime area, activity concentrations of 226Ra and 228Ra in open ocean regions typically remain below 5 Bq m-3 (OSPAR, 2022). In contrast, levels in PW can be up to three orders of magnitude higher (Betti et al., 2004; NRPA, 2005; Eriksen et al., 2006). Annually, Norwegian discharges of 226Ra and 228Ra from produced water are approximately 800 GBq (1 GBq = 109 Bq), with the highest volumes occurring in the North Sea (miljostatus.no). Discharges to the Norwegian Sea are roughly an order of magnitude lower, and discharges from UK petroleum industry in the North Sea are comparable to those from Norway (OSPAR, 2022).
To assess the environmental impact of petroleum activities, the industry is mandated to conduct environmental monitoring as outlined by the Norwegian Environment Agency (2015; 2020).
This report presents the findings from analyses of 210Pb, 226Ra, 228Ra and 228 Th in ling (Molva molva) and cusc (Brosme brosme) collected at Hywind, Snorre A, Oseberg and Sognesjøen (control location) in 2024. The work is part of the water column monitoring.
Additionally, we report findings from analyses of 210Pb, 226Ra, 228Ra and 228Th in sediments collected in Region II in the North Sea and Region VI in the Norwegian Sea in 2024. The results are contextualized against parameters such as grain size and organic content. In total seven sediment cores have been 210Pb-dated in order to study potential changes in contamination levels over time. The work is part of the regional sediment monitoring.
Data on cesium-137 (137Cs) are included for comparison, and to support results from the 210Pb-dating. 137Cs is an anthropogenic radionuclide, and it is not discharged from the petroleum industry. The main sources to the North Atlantic are fallout from nuclear weapons tests in the 1950s and 60s, the Chernobyl accident in 1986 and discharges from the nuclear fuel reprocessing plants Sellafield (UK) and La Hague (F).
2 - Sample collection and preparation
2.1 - Fish samples
Samples of ling (Molva molva) and cusc (Brosme brosme) were collected as part of the water column monitoring. The samples arrived frozen to the Institute of Marine Research (IMR). Upon arrival at IMR, samples of muscle and bone from 10 fish collected from the same location were pooled. Approximately 150-200 g muscle and 50 g bone, respectively, were taken from each fish. Muscle samples were homogenized in a conventional food processor, freeze dried (Labconoco FreeZone) and the dry samples were homogenized again using the food processor. Bone samples were also freeze dried (Labconco FreeZone) but homogenized using a cryogenic mill with dual grinding and cooling chambers (SPEX SamplePrep Freezer/Mill 6875D. A list of samples including sample locations, sampling dates, length and weights is given in Table 1. Information about sample sizes and dry weight content is given in Table 2.
Lat N
Long E
Sampledate
Species
n
Length (cm)
Weight (g)
Min
Max
Average
Min
Max
Average
Hywind
61.33
2.72
29.04.24
Ling (Molva molva)
10
97
127
108.7
4500
11700
7358
Snorre A
61.46
2.11
02.05.24
Ling (Molva molva)
10
69
155
103.9
1750
22000
7333
Snorre A
61.46
2.11
26.03.24
Cusk (Brosme brosme)
10
59
82
67.5
2050
6210
3700
Oseberg
60.74
3.25
21.03.24
Ling (Molva molva)
10
85
142
110.1
3780
22300
9486
Oseberg
60.74
3.25
21.03.24
Cusk (Brosme brosme)
10
49
93
67.2
1138
8900
3634
Sognesjøen
61.35
2.25
26.03.24
Cusk (Brosme brosme)
10
34
63
47.3
363
2430
1155
Table 1 Sample locations, sampling dates, length (cm) and weight (g) of collected fish samples
Muscle
Bone
Sample
Dry weight %
Sample
Sample
Dry weight %
Sample
Species
dw (g)
(g/100g)
ID
dw (g)
(g/100g)
ID
Hywind
Ling (Molva molva)
121.49
20.77
2024-992/3
113.06
34.54
2024-990/1
Snorre A
Ling (Molva molva)
127.48
20.54
2024-992/1
110.95
34.00
2024-990/2
Snorre A
Cusk (Brosme brosme)
108.46
20.42
2024-993/1
110.43
36.56
2024-991
Oseberg
Ling (Molva molva)
120.47
21.18
2024-992/2
-
-
-
Oseberg
Cusk (Brosme brosme)
118.44
20.84
2024-993/3
-
-
-
Sognesjøen
Cusk (Brosme brosme)
101.72
20.38
2024-993/2
-
-
-
Table 2 Sample dry weights (dw) (g) and dry weight content (% g/100g) of collected fish samples.
2.2 - Sediment samples
2.2.1 - Sample collection Region II
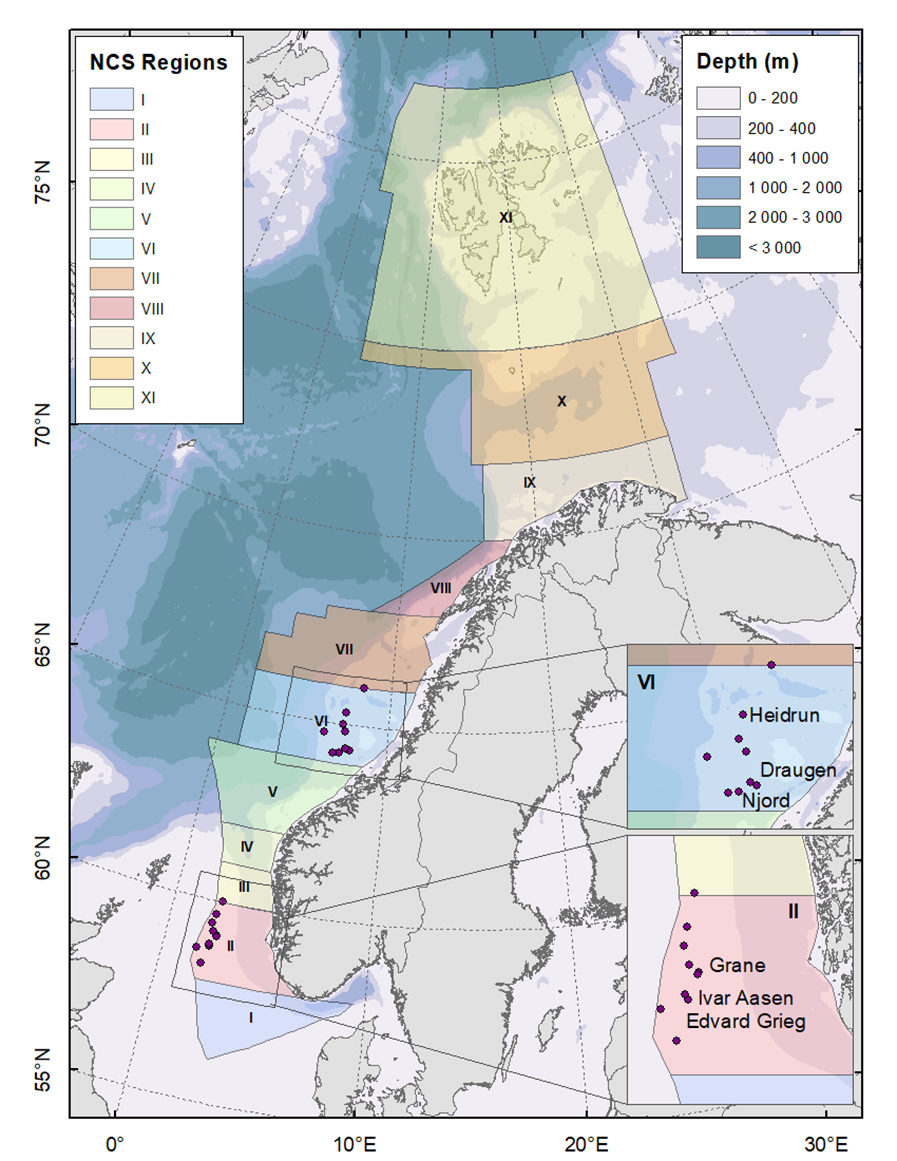
Sample collection in Region II is described by Akvaplan-niva (2024a). Briefly, sediment samples were collected by Akvaplan-niva onboard FSV “Ocean Response” between May 24th and June 11th, 2024, using a Van Veen grab (0.10 m2). Two different types of sediment samples were retrieved from the Van Veen grab: 1) So called “sectioned” samples, and 2) sediment cores. Sediment cores were collected to conduct 210 Pb-dating. Both sample types were collected by pushing PVC tubes of approximately 15 cm length and 4.5 cm inner diameter into the sediment. “Sectioned” samples were cut into 0-1, 1-3 and 3-6 cm onboard the ship and frozen. Sediment cores were sent whole to IMR in a frozen state. An overview of sampling stations, sampling dates, sampling direction, distance from the installation and sampling coordinates are given in Table 3 . The geographical locations of the sampling stations are shown in Figure 1 .
Field
Date
St. nr.
Depth (m)
Degrees(°)
Distance (m)
UTM sone 31, ED50
WGS84
Sample type
UTM East
UTM North
Latitude
Longitude
Edvard Grieg
29/05/24
EGR01
111
10
250
456662
6523174
58° 50.658'N
2°14.849' E
Sectioned
Edvard Grieg
29/05/24
EGR08
111
190
250
456576
6522682
58° 50.392'N
2°14.765' E
Pb-dating, Sectioned
Edvard Grieg
29/05/24
EGR09
111
190
500
456532
6522436
58° 50.259'N
2°14.722' E
Sectioned
Edvard Grieg
29/05/24
EGR10
111
190
1000
456445
6521943
58° 49.993'N
2°14.638' E
Sectioned
Grane
31/05/24
GRA11
130
208
253
470573
6558492
59° 9.759'N
2°29.027' E
Sectioned
Grane
31/05/24
GRA15
129
20
250
470775
6558950
59° 10.006'N
2°29.235' E
Sectioned
Grane
31/05/24
GRA16
129
20
500
470861
6559185
59° 10.133'N
2°29.323' E
Sectioned
Grane
31/05/24
GRA17
130
20
1000
471032
6559655
59° 10.387'N
2°29.499' E
Sectioned
Ivar Aasen
29/05/24
IAA03
115
108
445
454248
6531685
58° 55.229'N
2°12.234' E
Sectioned
Ivar Aasen
29/05/24
IAA29*
115
289
274
453567
6531915
58° 55.348'N
2°11.522' E
Sectioned
Ivar Aasen
29/05/24
IAA32
115
102
253
454073
6531772
58° 55.274'N
2°12.050' E
Pb-dating, Sectioned
Ivar Aasen
29/05/24
IAA36
116
108
750
454545
6531582
58° 55.175'N
2°12.545' E
Sectioned
Regional
26/05/24
REG2-08A
109
-
-
422936
6513198
58° 45.000'N
1°40.000' E
Pb-dating
Regional
25/05/24
REG2-17A
78
-
-
441633
6472712
58° 23.363'N
2°0.007' E
Pb-dating
Regional
30/05/24
REG2-20A
128
-
-
469297
6554935
59° 7.837'N
2°27.718' E
Pb-dating
Regional
01/06/24
REG2-21A
127
-
-
452182
6590203
59° 26.742'N
2°9.309' E
Pb-dating
Regional
02/06/24
REG2-22A
116
-
-
456430
6614401
59° 39.807'N
2°13.505' E
Pb-dating
Regional
10/06/24
REG2-28
110
-
-
466769
6655091
60° 1.785'N
2°24.123' E
Pb-dating
Regional
31/05/24
REG2-36
127
-
-
459203
6567845
59° 14.741'N
2°16.992' E
Pb-dating
Table 3 Overview of sampling stations, dates, depths (m), sampling directions (°), distance from installation (m) and sampling coordinates in Region II.
*Station name was changed to IAA37
Figure 1 The Norwegian continental shelf is divided into eleven geographical regions for the regional sediment monitoring. Each region is surveyed every third year with surveys alternating between regions. The fields investigated for naturally occurring radionuclides in 2024 (Heidrun, Draugen, Njord, Grane, Ivar Aasen and Edvard Grieg) are marked. The regional stations are shown but not marked.
2.2.2 - Sample collection Region VI
Sample collection in Region VI is described by Akvaplan-niva (2024b). Briefly, sediment samples were collected by Akvaplan-niva onboard FSV “Ocean Response” between April 6th and 24th 2024 using a Van Veen grab (0.15 m2). Two different types of sediment samples were retrieved from the Van Veen grab: 1) So called “sectioned” samples, and 2) sediment cores. Sediment cores were collected to conduct 210 Pb-dating. Both sample types were collected by pushing PVC tubes of approximately 15 cm length and 6.9 cm inner diameter into the sediment. “Sectioned” samples were cut into 0-1, 1-3 and 3-6 cm onboard the ship and frozen. Sediment cores were sent whole to IMR in a frozen state. An overview of sampling stations, sampling dates, sampling direction, distance from the installation and sampling coordinates are given in Table 4 . The geographical locations of the sampling stations are shown in Figure 1 .
Field
Date
St. nr.
Depth (m)
Degrees(°)
Distance (m)
UTM sone 31, ED50
WGS84
Sample type
UTM East
UTM North
Latitude
Longitude
Draugen
17/04/24
DRPL23
250
298
517
440750.4
7137353.6
64° 21.299'N
7° 46.282' E
Sectioned
Draugen
17/04/24
DRPL24
247
297
258
440976.1
7137225.4
64° 21.232'N
7° 46.566' E
Sectioned
Draugen
17/04/24
DRPL26
256
164
532
441353.2
7136598.9
64° 20.899'N
7° 47.049' E
Sectioned
Draugen
17/04/24
DRPL27
263
164
985
441479.1
7136163.0
64° 20.666'N
7° 47.216' E
Sectioned
Heidrun
12/04/24
HEI07
353
47
992
422350.9
7246677.4
65° 19.911'N
7° 19.85' E
Sectioned
Heidrun
12/04/24
HEI08
351
47
1491
422713.3
7247020.9
65° 20.101'N
7° 20.305' E
Sectioned
Heidrun
11/04/24
HEI42
342
225
559
421237.0
7245599.0
65° 19.315'N
7° 18.453' E
Sectioned
Heidrun
11/04/24
HEI47
350
45
350
421861.0
7246284.0
65° 19.693'N
7° 19.233' E
Sectioned
Njord
07/04/24
NJ13
332
336
250
412790.3
7128847.1
64° 16.362'N
7° 11.858' E
Pb-dating, Sectioned
Njord
08/04/24
NJ14
333
337
491
412699.8
7129072.7
64° 16.482'N
7° 11.739' E
Sectioned
Njord
07/04/24
NJ28-24
325
177
314
412907.0
7128307.0
64° 16.073'N
7° 12.021' E
Sectioned
Regional
16/04/24
R6-05
264
-
-
424888.5
7191030.3
64° 50.000'N
7° 24.915' E
Pb-dating
Regional
22/04/24
R6-08
350
-
-
395021.7
7126872.0
64° 15.001'N
6° 49.946' E
Pb-dating
Regional
08/04/24
R6-09
312
-
-
365162.0
7183766.1
64° 44.97'N
6° 9.886' E
Pb-dating
Regional
10/04/24
R6-17
295
-
-
415001.5
7210008.4
65° 0.071'N
7° 11.737' E
Pb-dating
Regional
15/04/24
R6-30
390
-
-
465959.0
7320299.0
65° 59.987'N
8° 14.895' E
Pb-dating
Regional
18/04/24
R6-31
280
-
-
430017.0
7143866.0
64° 24.683'N
7° 32.766' E
Pb-dating
Table 4 Overview of sampling stations, dates, depths (m), sampling directions (°), distance from installation (m) and sampling coordinates in Region VI.
2.2.3 - Preparation of sediment samples
Two different types of sediment samples arrived in a frozen state at the Institute of Marine Research (IMR):
“ Sectioned” samples. These were already cut in 0-1, 1-3 and 3-6 cm onboard the ship. The samples were freeze-dried using a Labconoco FreeZone freeze dryer until constant dry weight was achieved.
Sediment cores. These arrived whole and were cut into 1 cm slices to the bottom of the core at the Institute of Marine Research (IMR). The samples were transferred to pre-weighed aluminium containers and their wet weighs determined. The samples were thereafter frozen at ÷20 ◦C and freeze-dried using a Labconoco FreeZone freeze dryer until constant dry weight was achieved. Dry weight of all samples was determined.
Both “sectioned” samples and layers from sediment cores were homogenized either by hand or by using a Retsch Planetary Ball Mill PM 100. All samples were sieved with a 2 mm sieve. The samples were thereafter filled in counting geometries of appropriate size.
The two different Van Veen grabs used here are (too) small for collecting sediment cores. Their sizes and design only allow the use of short PVC tubes with a small diameter, resulting in short sediment cores and small sample sizes when cut in 1 cm thick sediment slices. Small sample sizes result in higher analytical detection limits and uncertainties. In the present study, we combined slices from two sediment cores to obtain sufficient sample material.
Additionally, the bottom end of the PVC tubes used for the sample collection lacked a sharpened end, potentially causing compaction of the sediment cores. This compaction may introduce a higher uncertainty in the slicing process. Moreover, several of the PVC tubes featured a jagged surface, complicating the cutting of the sediment cores and further introduced variability in the slicing accuracy.
Addressing these issues will be crucial in future studies.
3 - Sample analyses
3.1 - Fish samples
Six muscle samples and three bone samples were analysed at IMR for 210Pb, 226Ra, 228Ra, 228Th and 137Cs. A brief description of the analytical methods is given below. Activity concentrations are decay corrected to collection date. Analytical uncertainties (reported with 2 sigma) are due to uncertainty in sample preparation, calibration standards, calibration methods, counting statistics and background correction.
The sample sizes for muscle and bone varied from 101.72 to 127.48 and 110.43 to 113.06 g dry weight (dw), respectively ( Table 2 ). Homogenized samples were measured in a 200 ml polypropylene (PP) beaker. Counting times varied from 24 to 68 h.
To prevent loss of radon-222 (222Rn), the sample beakers were sealed airtight in aluminized Mylar (BoPET) bags and stored for at least four weeks prior to gamma analyses to achieve a secular equilibrium between 226Ra and its decay products. The methods for determining 226Ra, 228Ra and 228Th are not accredited, but are verified by analyzing NIST traceable reference sources from Eckert & Ziegler (SRM number RARB15075) and IAEA (RGU-1 and RGTh-1). The analytical method for measuring 210Pb is described by Sværen (2010) and Cutshall et al. (1983). The analytical method for measuring 137Cs is accredited in accordance with the standard ISO 17025. The 137 Cs method is regularly verified by participation in national and international intercomparison exercises.
The content of 210Pb ,226Ra, 228Ra, 228Th and 137Cs was determined using two low-background HPGe-detector systems: An N-type coaxial HPGe-detector (model no. GMX-M5970P–S) with preamplifier (model no. 257N) equipped with X-Cooler electric cryostat cooling system and DSPec multichannel analyzer; and a P-type coaxial HPGe-detector (model no.GEM-S8530P4-RB) with preamplifier (model no. 257P) equipped with X-Cooler III electric cryostat cooling system and DSPEC-50 multichannel analyzer. Relative efficiencies of the detectors at 1.33 MeV were 47% and 49%, respectively.
The HPGe-detectors were calibrated for 137Cs with certified NIST traceable calibration source from Eckert & Ziegler (SRS number 103778).
Determination of 210Pb includes corrections for self-attenuation of the 210Pb gamma peak at 46.5 keV. Corrections are carried out using a 210Pb point source (QSA Global GmbH). The minimum detectable activity was dependent on the counting time and sample weight but was in the range of 0.45–0.78 Bq kg-1 fw. The HPGe-detectors were calibrated for 210Pb with certified NIST traceable calibration sources from Eckert & Ziegler (SRS number 103777, 103778).
The 226Ra content was determined using gamma peaks of the decay products 214Pb (295.2 keV and 351.9 keV) and 214Bi (609.3 keV). This method is described by Kahn et al. (1990) and Köhler et al. (2002). The 228Ra content was determined using the 338.3 keV, 911.2 keV and 969.0 keV peaks of 228Ac. Variation in the radon and thoron background levels were controlled by routine background measurements. Background peaks were accounted for by Peak Background Correction (PBC) in the Gamma Vision® software. The HPGe-detectors were calibrated with certified NIST traceable calibration sources from IAEA (RGU-1 and RGTh-1) with the same geometry and sealed in a similar way as the samples. The minimum detectable activity for 226Ra and 228Ra was dependent on the counting time and sample weight, but was in the range of 0.13-0.45 Bq kg-1 fw for both nuclides.
The 228Th content was determined using the 238,6 KeV gamma peak of 212Pb. The minimum detectable activity was in the range of 0.11–0.20 Bq kg-1 fw. Certified NIST traceable reference material from IAEA (RGTh-1) was used for calibration.
3.2 - Sediment samples
3.2.1 - Institute of Marine Research
69 sectioned samples and 88 slices from sediment cores were analysed at IMR for 210Pb, 226Ra, 228Ra, 228Th and 137 Cs. A brief description of the analytical methods is given below. Activity concentrations are decay corrected to collection date. Analytical uncertainties (reported with 2 sigma) are due to uncertainty in sample preparation, calibration standards, calibration methods, counting statistics and background correction.
The sample sizes varied from 6.86 to 107.01 g dry weight (dw), depending on amount sample material availible. Homogenized samples were measured in a 19 or 35 ml polystyrene (PS) or 60 ml polypropylene (PP) beaker. Counting times varied from 6 to 83 h.
To prevent loss of radon-222 (222Rn), the sample beakers were sealed airtight in aluminized Mylar (BoPET) bags and stored for at least four weeks prior to gamma analyses to achieve a secular equilibrium between 226Ra and its decay products.
The methods for determining 210Pb and 228Th are not accredited but are verified by analyzing NIST traceable reference sources from IAEA (RGTh-1) and other reference materials (IAEA-TERC-2024-01 Sediment and Bauxite).
The analytical method for measuring 210Pb is described by Sværen (2010) and Cutshall et al. (1983).
The 226Ra, 228Ra and 137Cs methods are accredited accordance with the standard ISO 17025 and are regularly verified by participation in national and international intercomparison exercises.
The content of 210Pb ,226Ra, 228Ra, 228Th and 137Cs was determined using two low-background HPGe-detector systems: An N-type coaxial HPGe-detector (model no. GMX-M5970P–S) with preamplifier (model no. 257N) equipped with X-Cooler electric cryostat cooling system and DSPec multichannel analyzer; and a P-type coaxial HPGe-detector (model no.GEM-S8530P4-RB) with preamplifier (model no. 257P) equipped with X-Cooler III electric cryostat cooling system and DSPEC-50 multichannel analyzer. Relative efficiencies of the detectors at 1.33 MeV were 47% and 49%, respectively.
Determination of 210Pb includes corrections for self-attenuation of the 210Pb gamma peak at 46.5 keV. Corrections are carried out using a 210Pb point source (QSA Global GmbH). The minimum detectable activity was dependent on the counting time and sample weight but was in the range of 4.86-31.95 Bq kg-1 dw. The HPGe-detectors were calibrated for 210Pb with certified NIST traceable calibration sources from Eckert & Ziegler (SRS number 103777, 103778).
The 137Cs content was determined using the 661.7 KeV gamma peak. The minimum detectable activity for 137Cs was in the range of 0.28-1.96 Bq kg-1 dw. The HPGe-detectors were calibrated for 137Cs with certified NIST traceable calibration source from Eckert & Ziegler (SRS number 122308).
The 226Ra content was determined using gamma peaks of the decay products 214Pb (295.2 keV and 351.9 keV) and 214Bi (609.3 keV). This method is described by Kahn et al. (1990) and Köhler et al. (2002). The 228Ra content was determined using the 338.3 keV, 911.2 keV and 969.0 keV peaks of 228Ac. Variation in the radon and thoron background levels were controlled by routine background measurements. Background peaks were accounted for by Peak Background Correction (PBC) in the Gamma Vision® software. The HPGe-detectors were calibrated with certified NIST traceable calibration sources from IAEA (RGU-1 and RGTh-1) with the same geometry and sealed in a similar way as the samples. The minimum detectable activity for 226Ra and 228Ra was dependent on the counting time and sample weight but was in the range of 0.99-8.41 and 1.81-12.24 Bq kg-1 dw respectively.
The 228Th content was determined using the 238,6 KeV gamma peak of 212Pb. The minimum detectable activity was in the range of 0.44-2.63 Bq kg-1 dw. Certified NIST traceable reference material from IAEA (RGTh-1) was used for calibration.
3.2.2 - Institute for Energy Technology
60 sediment samples were analysed at Institute for Energy Technology (IFE) for the content of 210Pb, 226Ra, 228Ra, 228Th and 137Cs using high-resolution gamma-ray spectrometry. The analyses were conducted according to IFE’s standard method, which is based on NS-EN ISO 20042:2021; Measurement of radioactivity - Gamma-emitting nuclides - Generic testing method using gamma-ray spectrometry (ISO 20042:2019).
The amount of 210Pb was determined directly, while the amount of 226Ra was determined by measuring the activities of 214Pb and 214Bi. At radioactive equilibrium, the activities of 226Ra, 214Pb, and 214Bi are equal. The samples were set aside for approximately 3 weeks after being sealed in airtight containers, allowing for the ingrowth of radon and radon daughters (214Pb, 214Bi) to achieve radioactive equilibrium during the analysis. Self-absorption in the samples was taken into account for the determination of 210Pb. The self-absorption method for 210Pb is based on Cutshall et al. (1983).
The samples were received pre-treated and were measured without further treatment. Reported analytical uncertainty is an expanded uncertainty based on a standard uncertainty multiplied by a coverage factor of 2, which provides a coverage level of approximately 95%.
3.2.3 - 210 Pb-dating
Use of lead-210 (210Pb) (half-life 22 years) is the most common method for dating sediments deposited over the last century. The origin and distribution of 210Pb in the environment are described by e.g. Goldberg (1963), Koide et al. (1972) and Turekian et al. (1977). Briefly, disequilibrium between 210Pb and its parent isotope radium-226 (226Ra) (half-life 1600 years) arises through diffusion of the intermediate gaseous isotope radon-222 (222Rn) (half-life 3.8 days). 222Rn produced by the decay of 226Ra in soil escapes into the atmosphere, where it decays through a series of short-lived radionuclides to 210Pb. This 210Pb is subsequently deposited from the atmosphere via precipitation or dry deposition onto terrestrial surfaces or aquatic environments. In marine settings, 210 Pb is scavenged from the water column by organic matter and mineral particles into sediments on the seabed.
The 210Pb in marine sediments thus has two components: supported and unsupported 210Pb. Supported 210Pb derives from the in situ decay of 226Ra contained within the sediments. Because of the low diffusivity of 222Rn in saturated sediments, losses from the sediment column are negligible and supported 210Pb can in most situations be assumed equal to (in secular equilibrium with) 226Ra at all core depths. Unsupported 210Pb is the fraction deriving from atmospheric fallout. In practice, it is measured by the extent to which total 210Pb activity concentrations exceed 226Ra activity concentrations. Unsupported 210 Pb in the sediment column reduces over time according to the simple exponential radioactive decay law. The extent of the decline, if known, can be used to determine the sediment age.
As the collected sediment cores are short, equilibrium between 210Pbtotaland 226Ra is in most cases not achieved. In such instances, employing calculations based on the well-known CRS model (Appleby and Oldfield 1978, 1983) necessitates an estimation of any missing supported 210Pb below the base of the core (e.g. Appleby, 2001), thereby introducing a level of uncertainty. To mitigate this uncertainty, one can directly calculate the 210 Pb flux using chronostratigraphic dates (e.g., 1986 - Chernobyl accident, or 1963 - global fallout) as reference points (Appleby, 2001). Regrettably, this approach is only feasible for a few of the cores in the present study.
In a good part of the collected sediment cores, there are no clear exponential decay patterns in the 210Pbunsupported activity concentrations with depth. These cores are not possible to date. For the cores with an exponential decay pattern of 210Pbunsupported activity concentrations with depth, we employed the Constant Flux:Constant Sedimentation rate (CF:CS) model. This approach determines the average accumulation rate using least squares fit procedure, as demonstrated by Goldberg (1963).
Sedimentation rates are calculated as follows:
Sedimentation rate = λ• slope (Equation 1)
where λ=0.0312 y-1 and slope are given in semilogarithmic plots of the activity concentrations of 210Pbunsupp in the sediment layers from the core plotted against sediment depth. Age of the sediment layers are calculated by dividing sediment depth with sedimentation rate.
We report sedimentation rates using both volumetric (cm y-1) and cumulative dry mass (g cm-2) as the depth parameter, but we show only the plots where we use the cumulative dry mass as the depth parameter. Unlike the volumetric rate (cm y-1), the dry mass value (g cm-2 y-1 ) remains unaffected by sediment compaction, whether before or during coring.
The Constant Flux:Constant Supply model used in the present study is built on two main assumptions:
It is assumed that there is a constant flux of 210Pbunsupported from atmospheric deposition over time. This means that any temporal variations in the fallout of 210 Pb are negligible for the timescales being observed in the sediment.
Sediments are assumed to accumulate at a consistent rate (constant supply) over time. This assumption supports the idea that the sedimentation rate does not vary significantly during the period being studied.
These assumptions are rarely fulfilled, and this introduces uncertainty in the results.
Sediment age uncertainties were assessed following the method outlined by Binford (1990). With 95% confidence, these uncertainties typically range from about 1–2 (10–20%) years at ten years of age, 10 to 20 (10–20%) years at 100 years of age and 8–90 (5–60%) years at 150 years age.
3.2.4 - Grain size and TOC
Grain size and Total Organic Carbon (TOC) was determined by Akvaplan-niva.
4 - Results
4.1 - Fish samples
The activity concentrations of the natural radionuclides 210Pb, 226Ra, 228Ra and 228Th were below detection limits in all muscle and bone samples from both ling and cusc (Table 5). No maximum permitted level exist for these natural radionuclides in food. The activity concentrations of the anthropogenic radionuclide 137Cs in the muscle tissues of cusc and ling ranged from 0.21± 0.06 to 0.25 ± 0.07 Bq kg-1 fresh weight (fw) and from 0.31± 0.06 to 0.38 Bq kg-1 fw,respectively (Table 5). In the bones, the activity concentrations of 137Cs ranged from 0.12 to 0.13 Bq kg-1 fw, which were similar for both species and somewhat lower than those observed in muscle tissue (Table 5). The levels of 137Cs in muscle of cusc and ling are well below the maximum permitted level for radioactive cesium in food, which is set at 600 Bq kg-1 fw by Norwegian authorities. No apparent differences were observed in the activity concentrations of 137 Cs between the sampling stations, including Hywind, Snorre A, Oseberg and the control location Sognesjøen.
Muscle (Bq kg-1 fw)
Bone (Bq kg-1 fw)
Species
210Pb
226Ra
228Ra
228Th
137Cs
210Pb
226Ra
228Ra
228Th
137Cs
Hywind
Ling (Molva molva)
<0.57
<0.13
<0.22
<0.13
0.31
±
0.06
<0.78
<0.28
<0.45
<0.13
0.12
±
0.08
Snorre A
Ling (Molva molva)
<0.70
<0.16
<0.28
<0.15
0.35
±
0.07
<0.45
<0.15
<0.26
<0.12
0.12
±
0.06
Snorre A
Cusk (Brosme brosme)
<0.61
<0.15
<0.25
<0.15
0.21
±
0.06
<0.61
<0.23
<0.36
<0.11
0.13
±
0.08
Oseberg
Ling (Molva molva)
<0.63
<0.14
<0.25
<0.14
0.38
±
0.07
-
-
-
-
-
Oseberg
Cusk (Brosme brosme)
<0.74
<0.18
<0.31
<0.20
0.23
±
0.08
-
-
-
-
-
Sognesjøen
Cusk (Brosme brosme)
<0.62
<0.15
<0.27
<0.16
0.25
±
0.07
-
-
-
-
-
Table 5. Activity concentrations of 210Pb, 226Ra, 228Ra, 228Th and 137Cs (Bq kg-1 fresh weight (fw)) in muscle and bone of ling (Molva molva) and cusc (Brosme brosme). Analytical uncertainties are given with 2 sigma.
4.2 - Sediment samples
Raw data for Region II and VI are given in Appendix 1 and Appendix 2 , respectively.
4.2.1 - Region II - Grane
4.2.1.1 - Sectioned sediment cores
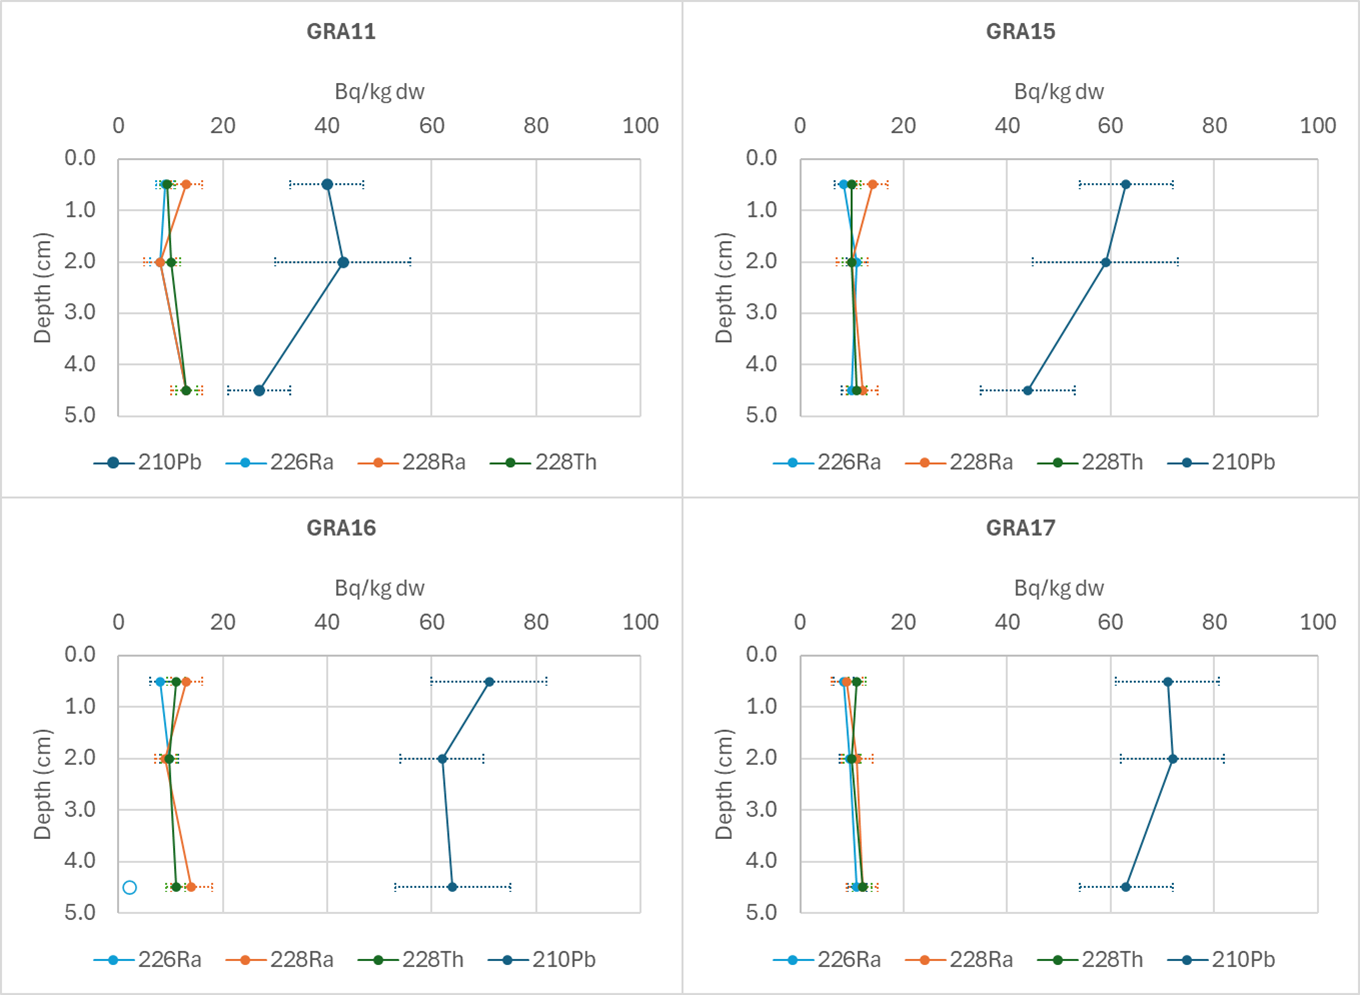
Activity concentrations of 226Ra, 228Ra and 228Th range from below detection limit to 14 Bq kg-1 dry weight (dw) (Figure 2). The activity concentrations are relatively similar down core for all three radionuclides. Activity concentrations of 210Pbtot in the surface layer(0-1 cm) range from 40 to 71 Bq kg-1 dw. There is a tendency of decreasing levels down core, but this is not equally evident in all cores. Activity concentrations of 137 Cs were below detection limit in all samples and are not shown.
Figure 2 Activity concentrations of 210Pbtot, 226Ra, 228Ra and 228Th (Bq kg-1 dw) in sectioned (0-1, 1-3 and 3-6 cm) sediment cores from stations GRA11, GRA15, GRA16 and GRA17. Results below detection limits are shown as open circles. Average depths of each section are plotted. Analytical uncertainties are given as ±2σ .
4.2.2 - Region II – Ivar Aasen
4.2.2.1 - Sectioned sediment cores
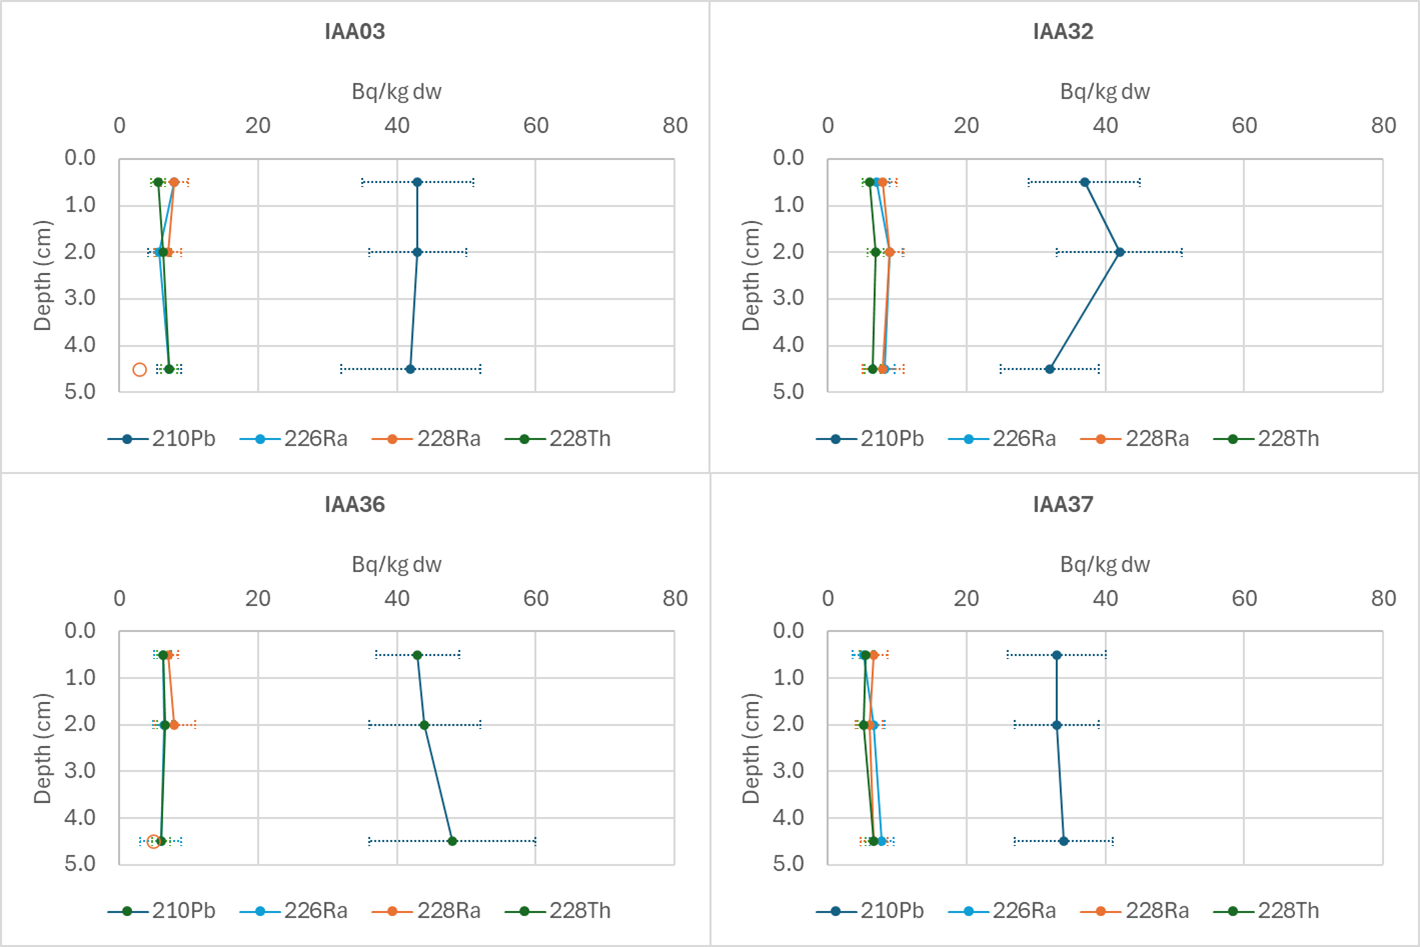
Activity concentrations of 226Ra, 228Ra and 228Th range from below detection limit to 9 Bq kg-1 dw (Figure 3). The activity concentrations are relatively similar down core for all three radionuclides. Activity concentrations of 210Pbtot in the surface layer(0-1 cm) range from 33 to 43 Bq kg-1 dw and are relatively similar down core (Figure 3). Activity concentrations of 137Cs were below detection limit in all but one sample and are not shown.
Figure 3 Activity concentrations of 210Pbtot, 226Ra, 228Ra and 228Th (Bq kg-1 dw) in sectioned (0-1, 1-3 and 3-6 cm) sediment cores from stations IAA03, IAA32, IAA36 and IAA37. The station name of IAA37 was originally IAA29. Results below detection limits are shown as open circles. Average depths of each section are plotted. Analytical uncertainties are given as ±2σ .
4.2.2.2 - 210Pb dated cores
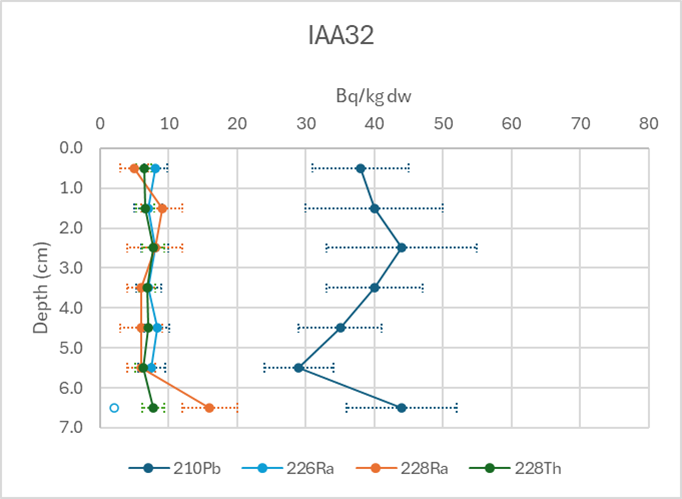
One sediment core was collected at station IAA32 with the aim of performing 210Pb-dating. Activity concentrations of 226Ra, 228Ra and 228Th, ranging from below detection limit to 16 Bq kg-1 dw, are low and generally similar down core (Figure 4). One exception is a slightly elevated activity concentration of 228Ra in the 6-7 cm layer. The levels of 210Pbtot throughout the core range from 29 to 44 Bq kg-1 dw (Figure 4), which also are low levels. There is no apparent pattern in the activity concentration of 210Pbtot down core. Activity concentrations of 137Cs were below detection limit in all sediment layers and are not shown. The core is only 7 cm long, which is normally too short to perform 210Pb dating. Equilibrium between 226Ra and 210Pbtotal is not achieved. The core is not suitable for 210 Pb-dating.
Figure 4 Activity concentrations of 210Pbtot226Ra, 228Ra and 228Th (Bq kg-1 dw) in a sediment core from station IAA32. Results below detection limits are shown as open circles. Analytical uncertainties are given as ±2σ .
4.2.3 - Region II – Edvard Grieg
4.2.3.1 - Sectioned sediment cores
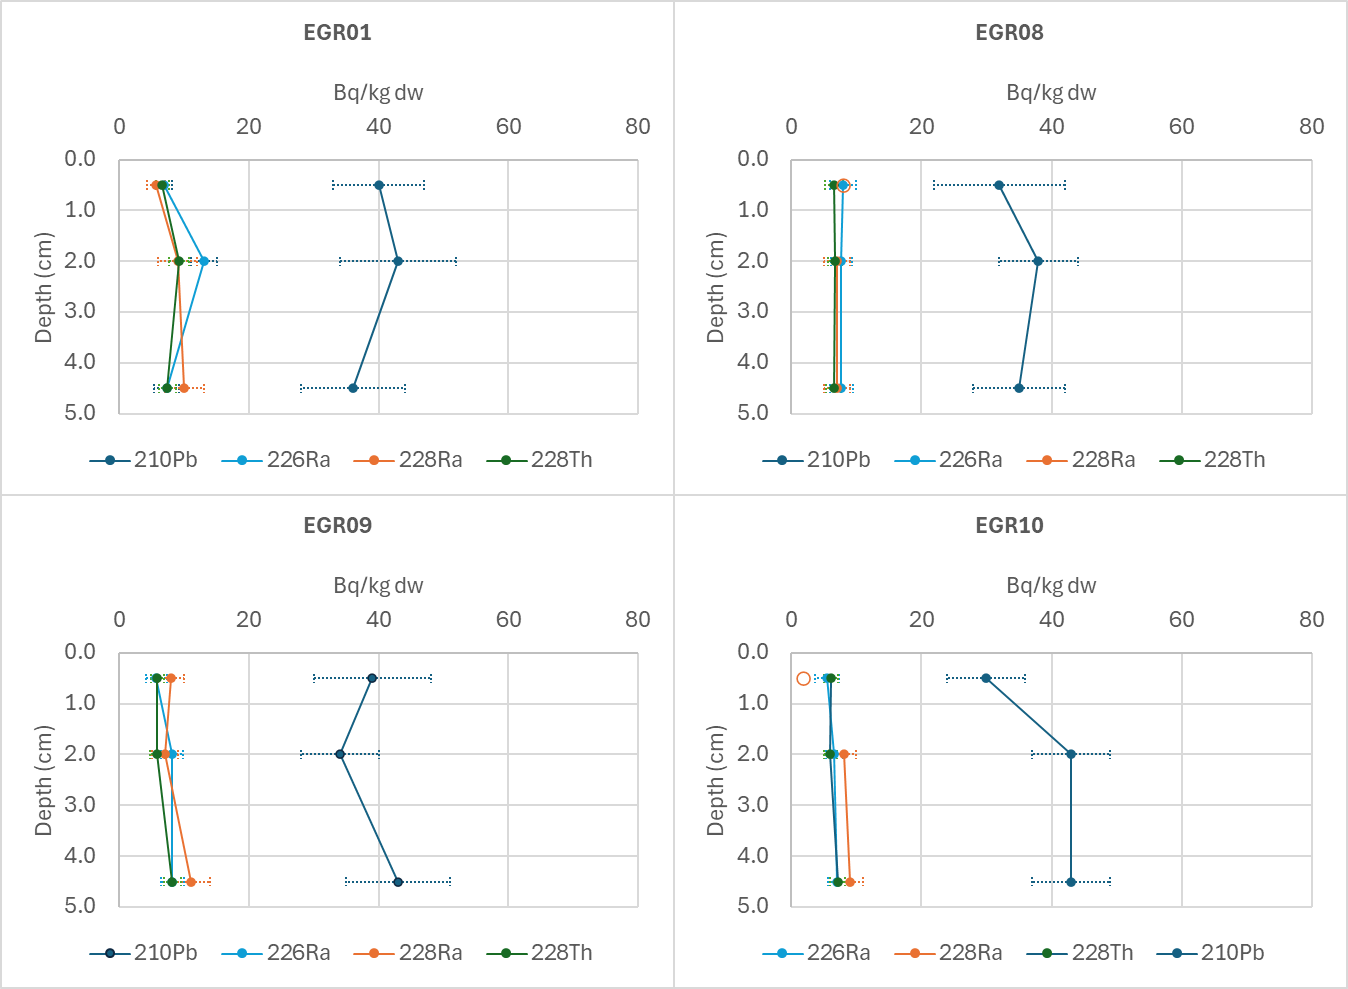
Activity concentrations of 226Ra, 228Ra and 228Th range from below detection limit to 13 Bq kg-1 dw (Figure 5). The activity concentrations are relatively similar down core for all three radionuclides. Activity concentrations of 210Pbtot in the surface layer(0-1 cm) range from 32 to 43 Bq kg-1 dw and are relatively similar down core (Figure 5). Activity concentrations of 137Cs were below detection limit in all but one sample and are not shown.
Figure 5 Activity concentrations of 210Pbtot, 226Ra, 228Ra and 228Th (Bq kg-1 dw) in sectioned (0-1, 1-3 and 3-6 cm) sediment cores from stations EGR01, EGR08, EGR09 and EGR10. Results below detection limits are shown as open circles. Average depths of each section are plotted. Analytical uncertainties are given as ±2σ .
4.2.3.2 - 210 Pb dated core
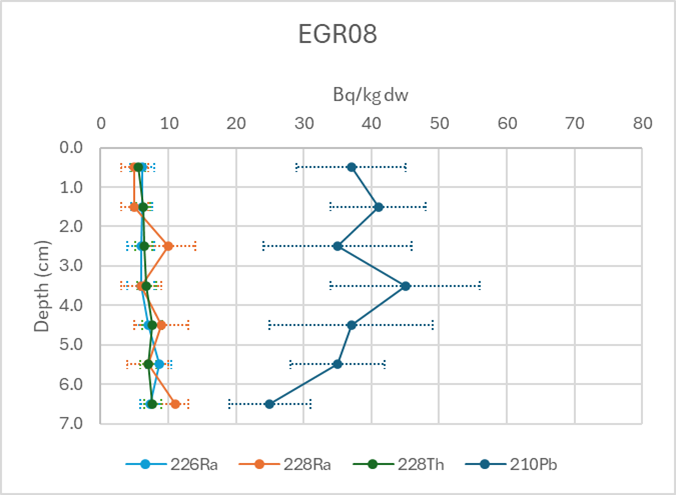
In addition to the four sectioned cores, a sediment core was collected at station EGR08 with the aim of performing 210Pb-dating. Activity concentrations of 226Ra, 228Ra and 228Th, ranging from 5 to 11 Bq kg-1 dw, are low and similar down core (Figure 6). The levels of 210Pbtot range from 25 to 45 Bq kg-1 dw (Figure 6), which also are low levels. There is no apparent down core pattern in the activity concentration of 210Pbtot. The core is only 7 cm long, which is also normally too short to perform a 210Pb dating. Equilibrium between 226Ra and 210Pbtotal is not achieved. The core is not suitable for 210Pb-dating.
Activity concentrations of 137Cs were below detection limit in all but one sample and are not shown.
Figure 6 Activity concentrations of 210Pbtot226Ra, 228Ra and 228Th (Bq kg-1 dw) in a sediment core from station ER08. Analytical uncertainties are given as ±2σ .
4.2.4 - Region II – Regional stations
4.2.4.1 - 210 Pb dated cores,
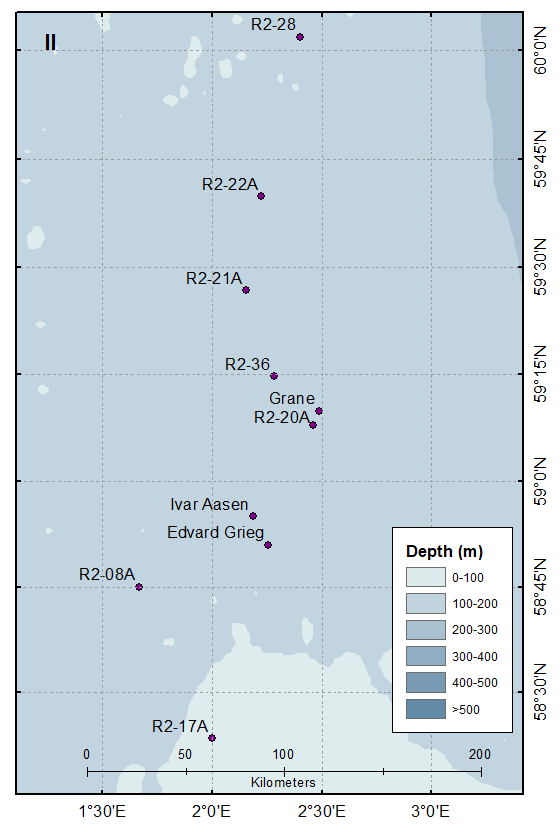
Sediment cores were collected from seven regional stations in Region II with the aim of performing 210Pb-dating. The locations of the stations are shown in Figure 7 .
Figure 7 Location of the Regional stations in Region II from where cores were collected for 210Pb-dating. The locations of surveyed stations at Grane, Edvard Grieg and Ivar Aasen are also shown.
Activity concentrations of 226Ra, 228Ra and 228Th are relatively uniform down core at all stations (Figure 8), except there is a tendency of increasing levels of 228Ra towards the bottom for some of the cores. This can be explained by a decreasing content of clay and silt towards the top of the sediment profile, but it can also be explained by a diffusive flux of radium from down in the core towards the top.
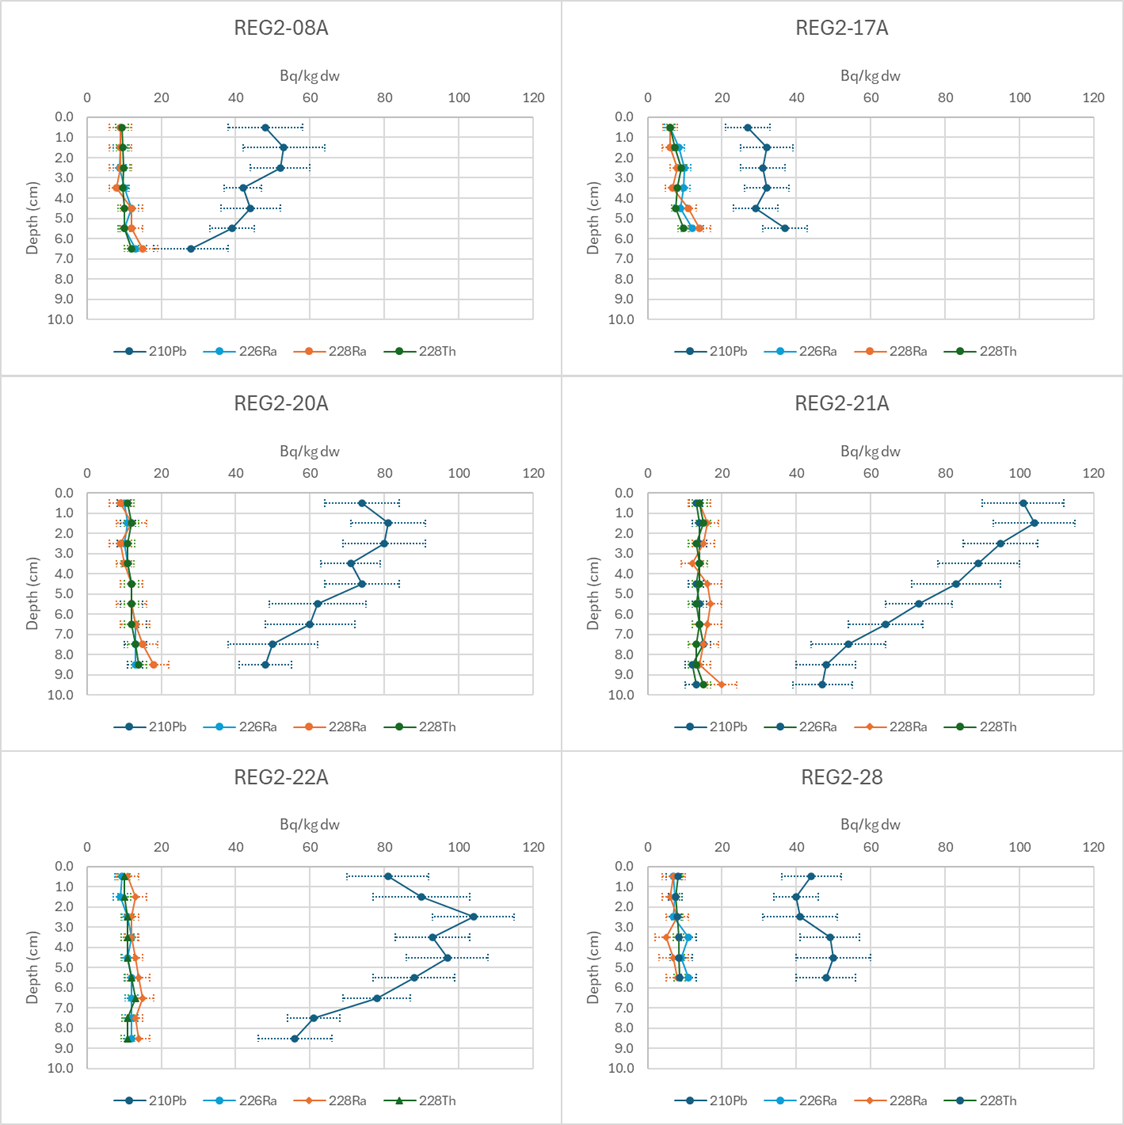
Activity concentrations of 210Pbtot range from approximately 20 to 100 Bq kg-1 dw in all the layers from all the cores (Figure 8). In most of the cores, there are no apparent exponential decay in the activity concentrations of 210Pbtot down core. Furthermore, equilibrium between 226Ra and 210Pbtot is not achieved in any of the cores. The cores collected from REG2-17A, REG2-28 and REG2-36 do not show a steady decrease of 210Pbtot down core. The cores collected from stations REG2-08A, REG2-20A and REG2-22A show a steady decrease of 210Pbtot in the lower part of the core, while the upper part of the core has a disturbed pattern of 210Pbtot. None of these cores are suitable for 210 Pb-dating.
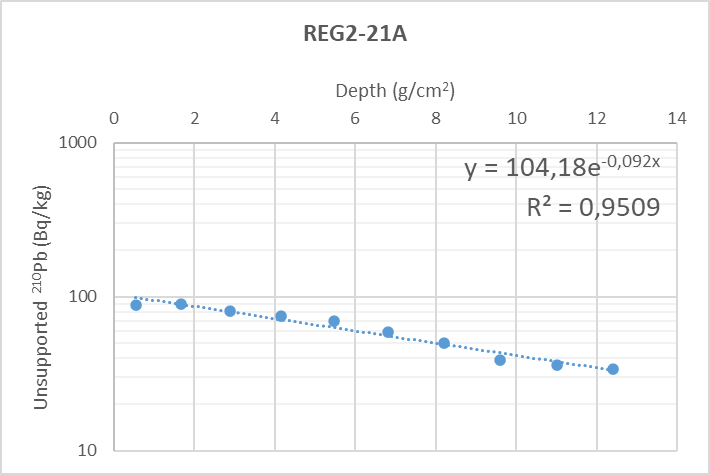
The core collected from station REG2-21A show, however, a relatively undisturbed exponential decay in the activity concentration of 210Pbtot down core except for the uppermost layer (Figure 8), and we have chosen to date this core.
Figure 8 Activity concentrations of 210Pbtot226Ra, 228Ra and 228Th (Bq kg-1 dw) in sediment cores from regional stations, Region II. Analytical uncertainties are given as ±2σ .
Activity concentrations of 210Pbunsupp in the sediment layers from the core collected at station REG2-21A are plotted against sediment depth (g cm-2) in Figure 9 .
Figure 9 Activity concentrations of 210Pbunsupp in sediment layers from the core collected at station REG2-21A plotted against sediment depth (g cm-2). Average sedimentation rates were determined using exponential curve fits. Note logarithmic scales on the Y-axes.
The average sedimentation rate at station REG2-21A is calculated using Equation 1 to 0.34 g cm-2y-1(0.26 cm y-1). Estimated ages of the sediment layers are given in Table 6 .
Depth(g cm-2 y-1)
Estimated age(y)
Estimated year
0.0
0
2024
±
0
0.5
6
2018
±
1
1.7
17
2007
±
3
2.9
29
1995
±
6
4.2
40
1984
±
8
5.5
51
1973
±
10
6.8
63
1961
±
13
8.2
74
1950
±
15
9.6
86
1938
±
17
11.0
97
1927
±
19
12.4
109
1915
±
22
Table 6 Estimated ages of sediment layers from the sediment core collected at station REG2-21A calculated based on the CF:CS method.
There is a discrepancy in the calculated sedimentation rates for the two different depth parameters. The reason for this is unknown. Using g cm-2 y-1 as the depth parameter, the deepest layer (9-10 cm) is dated to 1915 ±22 years (Table 6). In this case, the upper part of the core could potentially be affected by pollution from the petroleum industry, while the lower half of the core should be unaffected.
Activity concentrations of 137Cs are below detection limits in most sediment layers in the core. In samples where activity concentrations were above detection limits, the levels were low, ranging from 0.3 to 1 Bq kg-1 dw. The results do not show any patterns and cannot be used to support 210Pb-dating. Activity concentrations of 137Cs are not shown in figures.
4.2.5 - Region VI – Heidrun
4.2.5.1 - Sectioned sediment cores
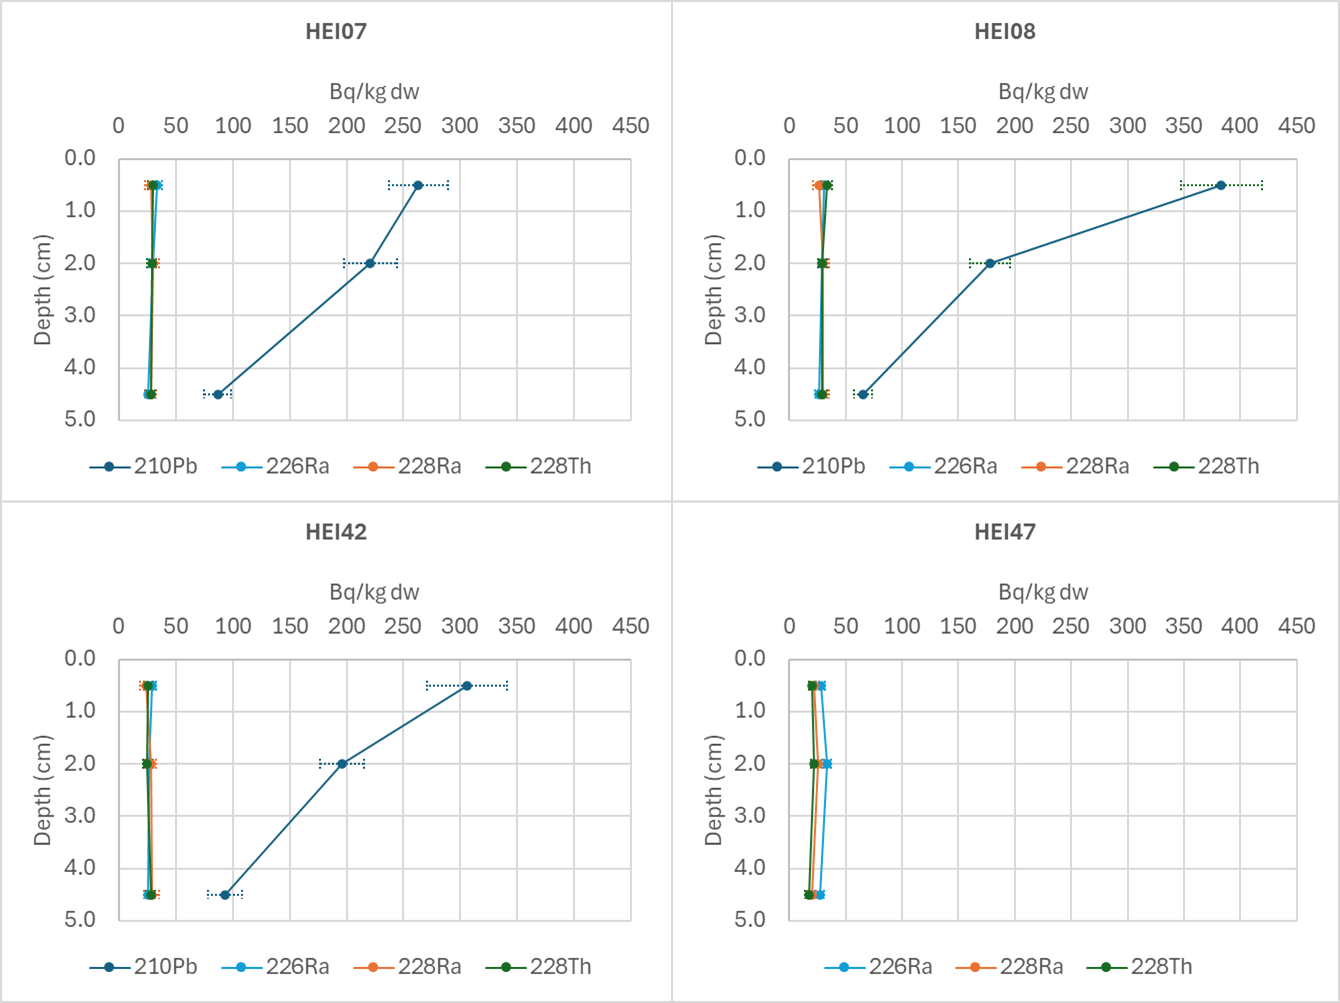
Activity concentrations of 226Ra, 228Ra and 228Th ranged from 17 to 34 Bq kg-1 dry weight (dw) (Figure 10). The activity concentrations are relatively similar down core for all three radionuclides. The levels of 210Pbtot in the surface layer(0-1 cm) range from 263 to 383 Bq kg-1 dw, and are decreasing down core, probably due to radioactive decay. It was not possible to measure 210Pbtot in HEI47 due to high self-attenuation in the sample, due to presence of elements with high atomic number.
Figure 10 Activity concentrations of 210Pbtot, 226Ra, 228Ra and 228Th (Bq kg-1 dw) in sectioned (0-1, 1-3 and 3-6 cm) sediment cores from stations HEI07, HEI08, HEI42 and HEI47. Average depths of each section are plotted. It was not possible to determine the activity concentrations of 210 Pb for station HEI47 due to high self-attenuation in the sample, due to presence of elements with high atomic number. Analytical uncertainties are given as ±2σ .
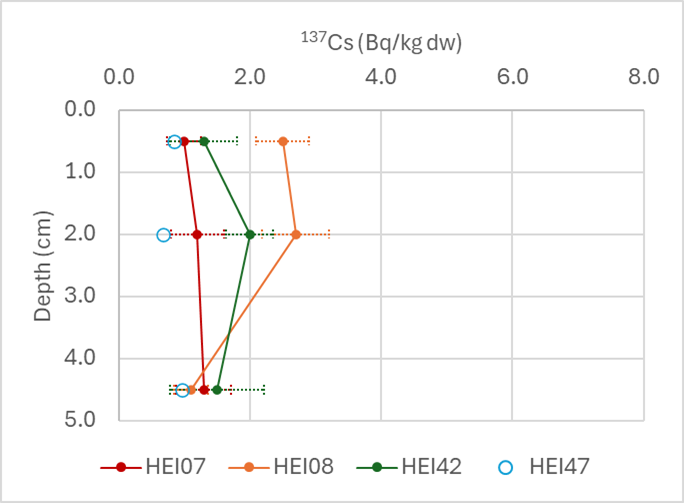
Activity concentrations of 137Cs ranged from below detection limits to 2.5 Bq kg-1 dw (Figure 11). Activity concentrations in the three layers at station HEI47 were all below detection limits.
Figure 11 Activity concentrations of 137Cs (Bq kg-1 dw) in sectioned (0-1, 1-3 and 3-6 cm) sediment cores from stations HEI07, HEI08, HEI42 and HEI47. Average depths of each section are plotted. Activity concentrations in HEI47 were below detection limits in all samples. Detection limits are shown as open symbols. Analytical uncertainties are given as ±2σ .
4.2.6 - Region VI – Njord
4.2.6.1 - Sectioned sediment cores
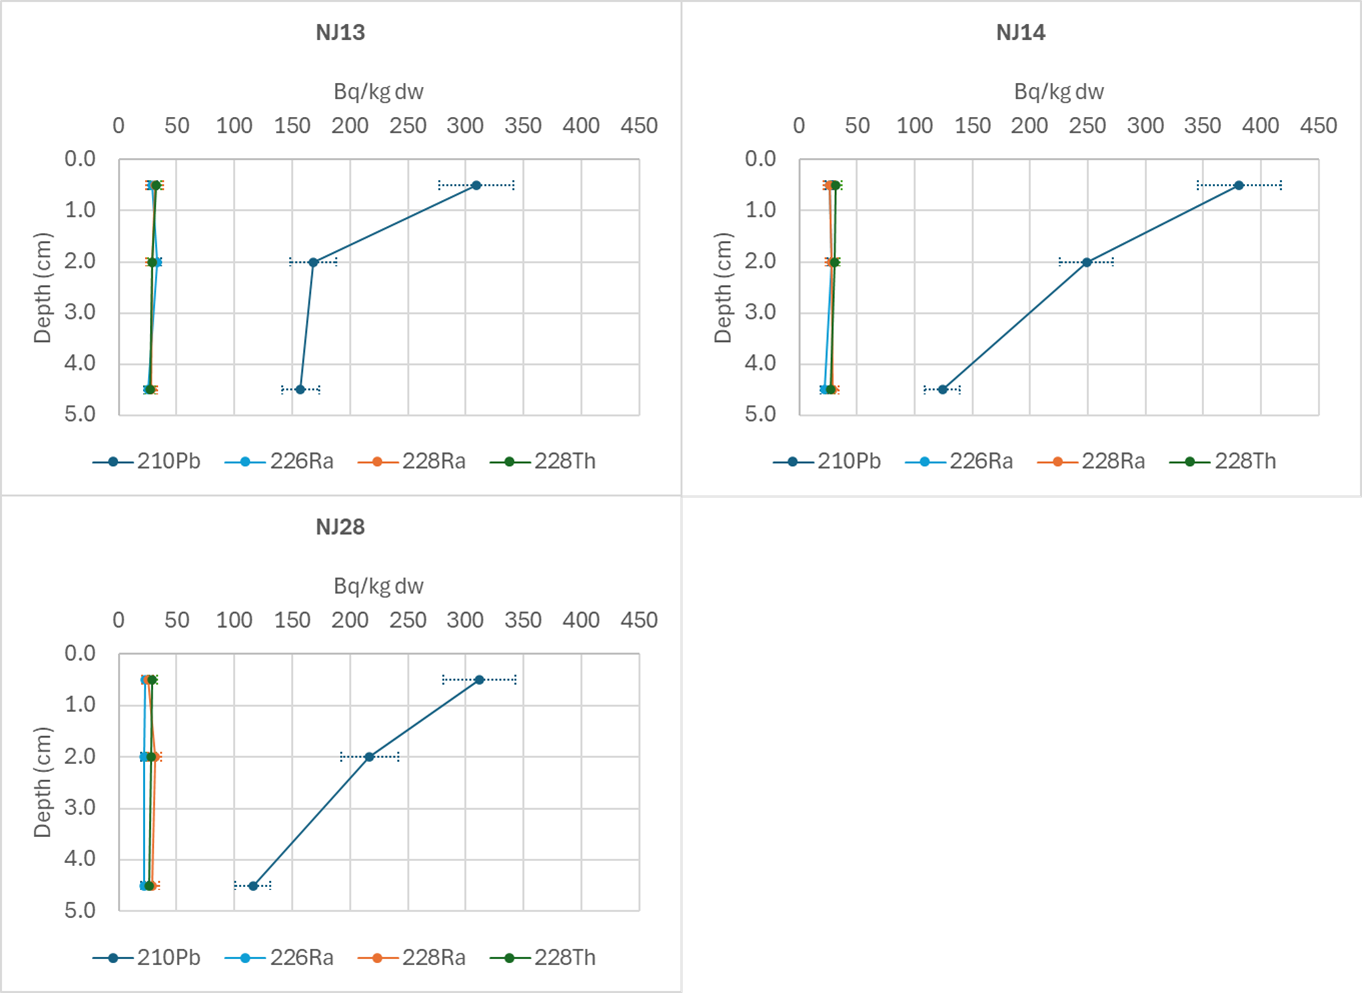
Activity concentrations of 226Ra, 228Ra and 228Th ranged from 22 to 33 Bq kg-1 dw (Figure 12). The activity concentrations are relatively similar down core for all three radionuclides. The levels of 210Pbtot in the surface layer(0-1 cm) range from 309 to 381 Bq kg-1 dw, and are decreasing down core, probably due to radioactive decay.
Figure 12 Activity concentrations (Bq kg-1 dw) of 210Pbtot, 226Ra, 228Ra and 228Th in sectioned (0-1, 1-3 and 3-6 cm) sediment cores from stations NJ13, NJ14 and NJ28. Average depths of each section are plotted. Analytical uncertainties are given as ±2σ .
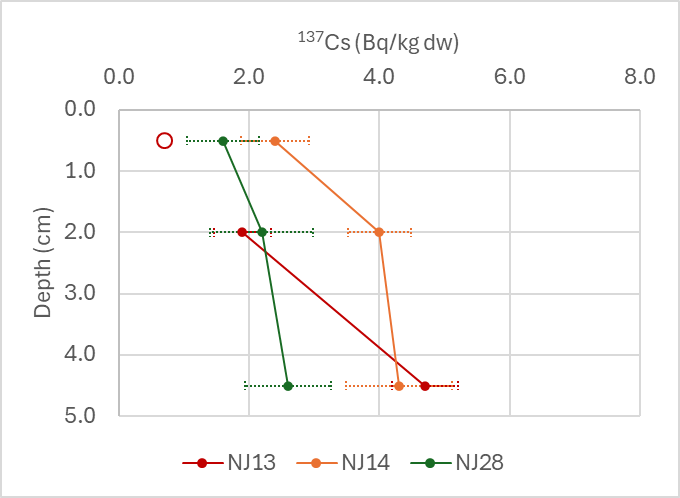
Activity concentrations of 137Cs ranged from below detection limit to 4.7 Bq kg-1 dw (Figure 13).
Figure 13 Activity concentrations of 137Cs (Bq kg-1 dw) in sectioned (0-1, 1-3 and 3-6 cm) sediment cores from stations NJ13, NJ14 and NJ28. Average depths of each section are plotted. Activity concentrations below detection limits are shown with open symbols. The detection limit is plotted. Analytical uncertainties are given as ±2σ .
4.2.6.2 - 210Pb dated cores
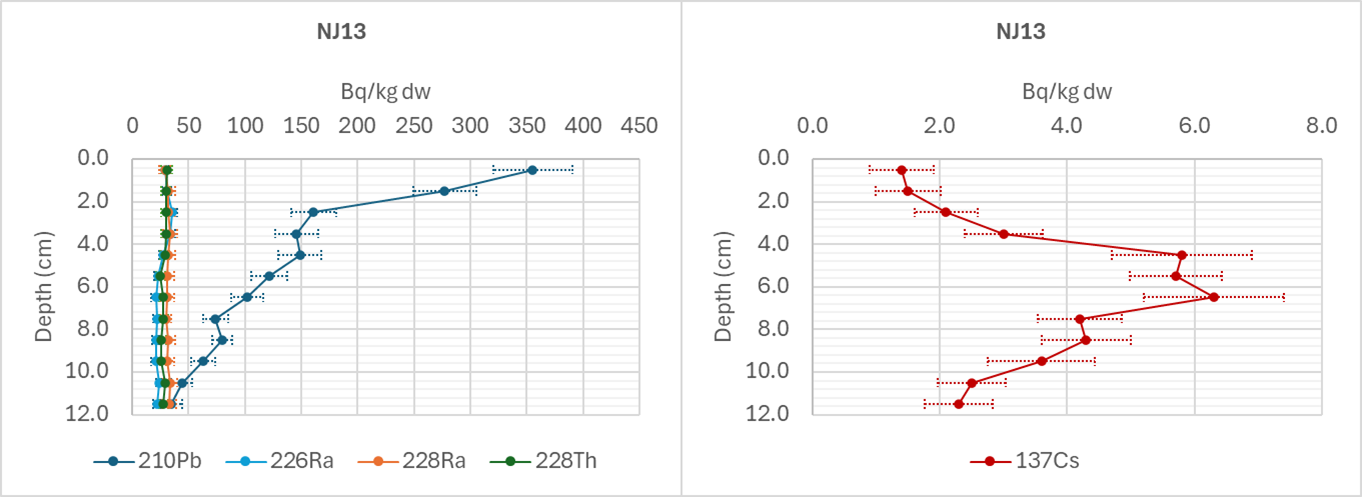
In addition to the three sectioned cores, a sediment core was collected at station NJ13 with the aim of performing 210Pb-dating. Activity concentrations of 226Ra, 228Ra and 228Th range from 21 to 36 Bq kg-1 dw and are similar down core (Figure 14, left). The activity concentration of 210Pbtot is 355 Bq kg-1 dw in the 0-1 cm layer and decrease exponentially to 35 Bq kg-1 dw in the 11-12 cm layer. This is equivalent to 226Ra-levels. This core is suitable for 210Pb-dating.
Activity concentrations of 137Cs range from 1.4 to 6.3 Bq kg-1 dw, and there is a distinct peak between 4-7 cm (Figure 14 , right).
Figure 14 Activity concentrations (Bq kg-1 dw) of 210Pbtot226Ra, 228Ra and 228Th (left) and 137Cs (right) in a sediment core collected from station NJ13. Analytical uncertainties are given as ±2σ .
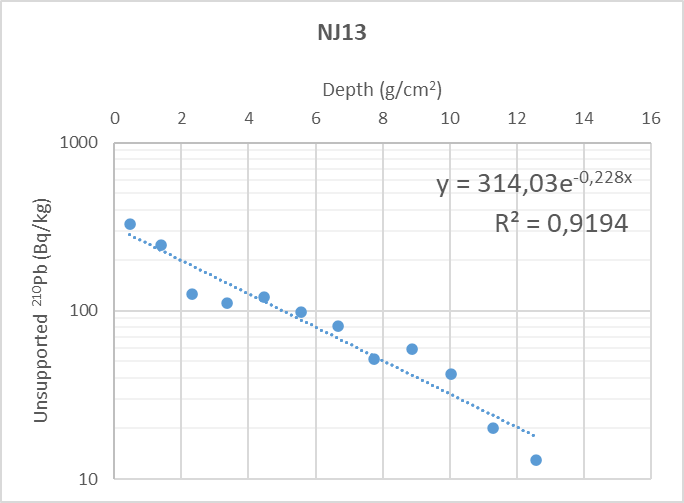
Activity concentrations of 210Pbunsupp in the sediment layers from the core collected at station NJ13 are plotted against sediment depth (cm) in Figure 15 .
Figure 15 Activity concentrations of 210Pbunsupp (Bq kg-1 dw) in the sediment layers from the core collected at station NJ13 plotted against sediment depth (g cm-2 ). Sedimentation rate was determined using an exponential curve fit.
The sedimentation rate at station NJ13 is calculated according to Equation 1 to 0.14 g cm-2 y-1 (0.12 cm y-1). Estimated age of the sediment layers are given in Table 7 .
Depth(g cm-2 y-1)
Estimated age(y)
Estimated year
0.0
0
2024
±
0
0.5
3
2021
±
1
1.4
10
2014
±
2
2.3
17
2007
±
3
3.4
25
1999
±
5
4.5
33
1991
±
7
5.6
41
1983
±
8
6.7
49
1975
±
10
7.8
57
1967
±
11
8.9
65
1959
±
13
10.0
73
1951
±
15
11.3
83
1941
±
17
12.6
92
1932
±
18
Table 7 Estimated age of sediment layers from the sediment core collected at station NJ13 calculated based on the CF:CS method.
The deepest layer in the core was deposited in 1932 ± 18 ( Table 7 ). This is before the start of the petroleum industry and should not be affected by pollution from this industry.
The 137Cs-peak between 4 and 7 cm (Figure 14, right) is most likely due to the Chernobyl accident in 1986. As the 137Cs-peak is rather broad, it is not possible to assign the year 1986 to a certain sediment layer. Nevertheless, it fits well with the 210Pb-dating and confirms that this is quite consistent.
4.2.7 - Region VI – Draugen
4.2.7.1 - Sectioned sediment cores
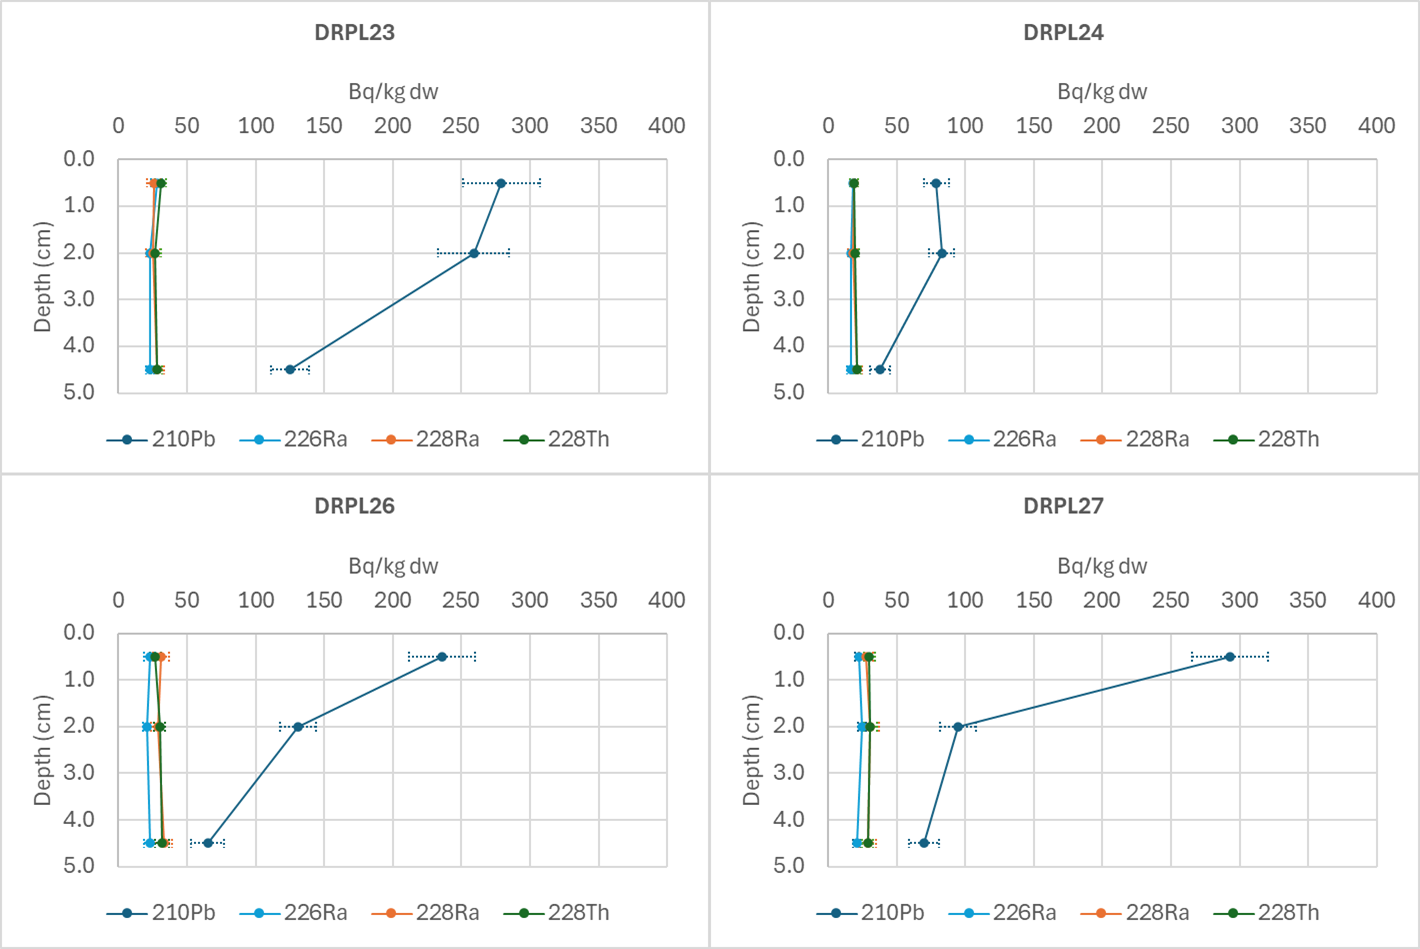
Activity concentrations of 226Ra, 228Ra and 228Th ranged from 17 to 32 Bq kg-1 dw (Figure 16). The activity concentrations are relatively similar down core for all three radionuclides. The levels of 210Pbtot in the surface layer(0-1 cm) range from 79 to 293 Bq kg-1 dw, and are decreasing down core, probably due to radioactive decay.
Figure 16 Activity concentrations of 210Pbtot, 226Ra, 228Ra and 228Th (Bq kg-1 dw) in sectioned (0-1, 1-3 and 3-6 cm) sediment cores from stations DRPL23, DRPL24, DRPL26 and DRPL27. Average depths of each section are plotted. Analytical uncertainties are given as ±2σ .
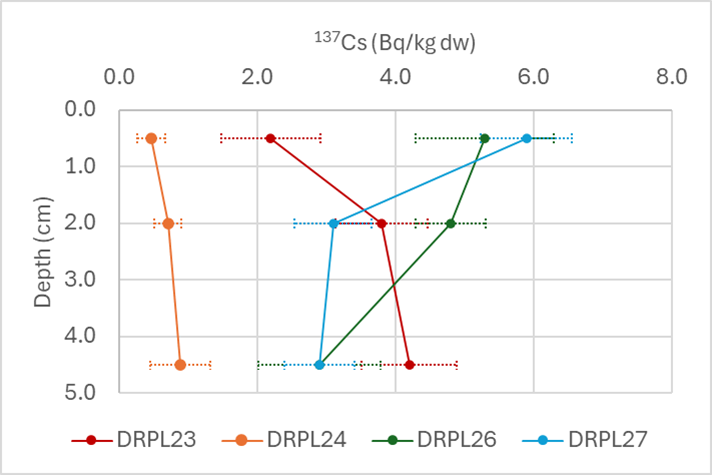
Activity concentrations of 137Cs ranged from 0.5 to 6 Bq kg-1 dw (Figure 17).
Figure 17 Activity concentrations of 137Cs (Bq kg-1 dw) in sectioned (0-1, 1-3 and 3-6 cm) sediment cores from stations DRPL23, DRPL24, DRPL26 and DRPL27. Average depths of each section are plotted. Analytical uncertainties are given as ±2σ .
4.2.8 - Region VI – Regional stations
4.2.8.1 - 210Pb dated cores
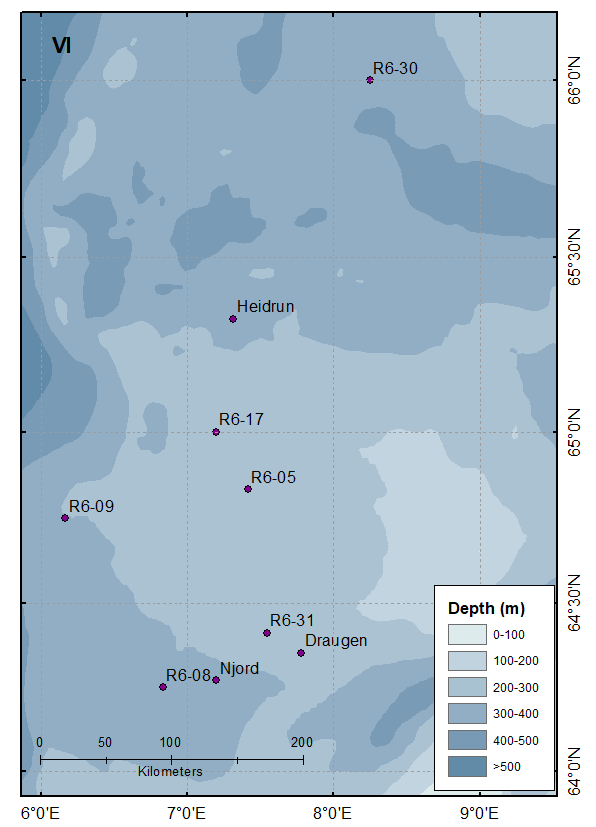
Sediment cores were collected from six regional stations in Region VI with the aim of performing 210Pb-dating. The locations of the stations are shown in Figure 18 .
Figure 18 Location of Regional stations in Region VI. The locations of Heidrun, Draugen and Njord are shown.
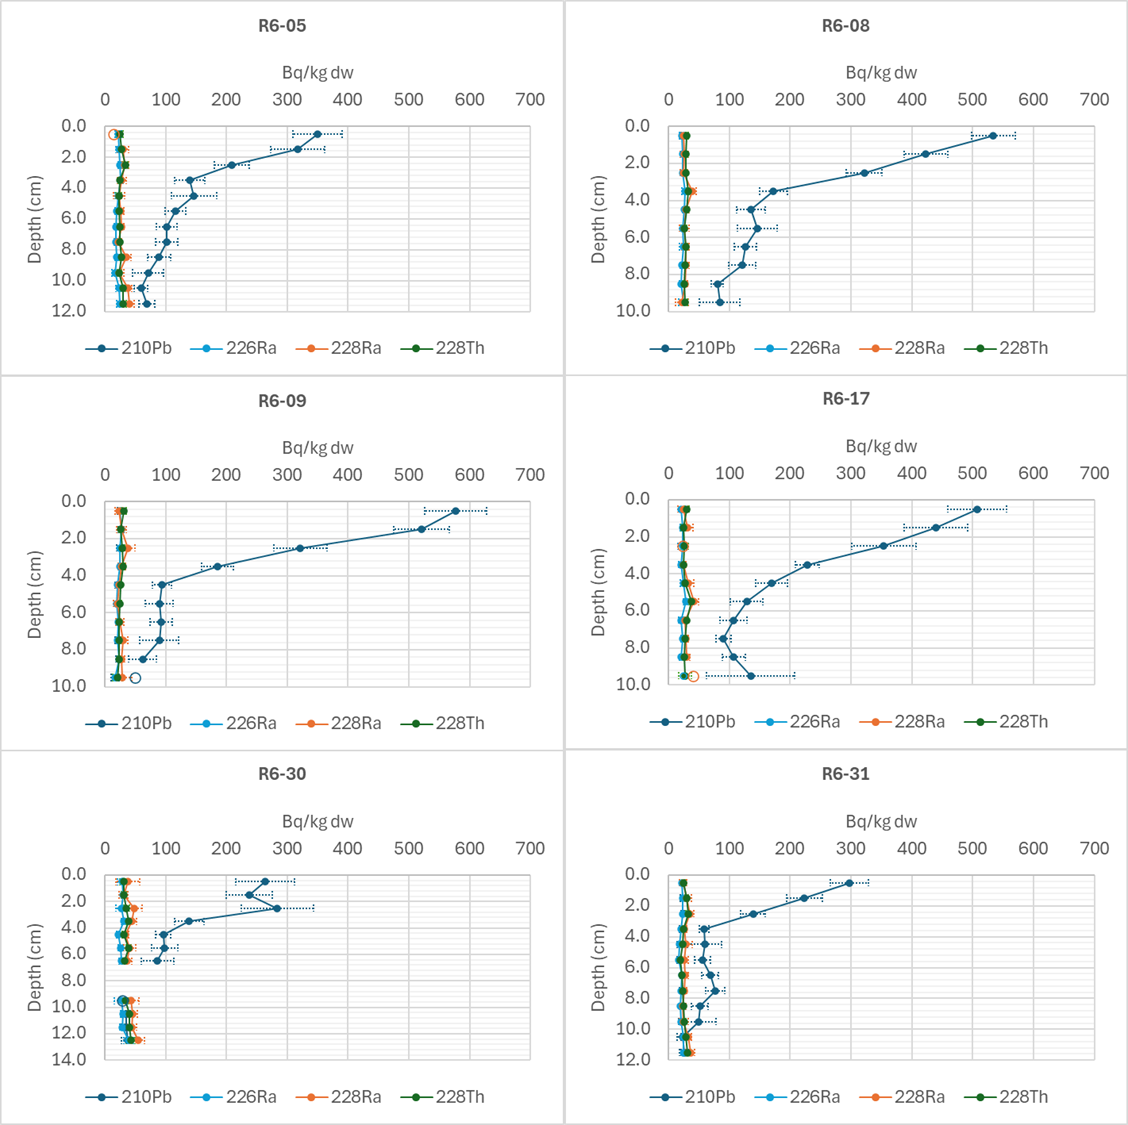
Activity concentrations of 226Ra, 228Ra and 228Th range from 17 to 55 Bq kg-1 dw (Figure 19). The activity concentrations are relatively uniform down core for all three radionuclides. Activity concentrations of 210Pbtot in the 0-1 cm layer range from 264 to 577 Bq kg-1 dw (Figure 19), and the levels show an exponential decay pattern in all cores except R6-30. This core seems disturbed or show lack of 210Pb deposition in the upper 2-3 cm. The activity concentrations of 210Pbtot are generally approaching equilibrium with 210Pbsupp (226Ra), but equilibrium is not quite achieved. We have performed 210Pb-dating of all cores except R6-30.
Figure 19 Activity concentrations of 210Pbtot226Ra, 228Ra and 228Th (Bq kg-1 dw) in sediment cores from regional stations, Region VI. Activity concentrations below detection limits are shown with open symbols. The detection limit is plotted. Analytical uncertainties are given as ±2σ .
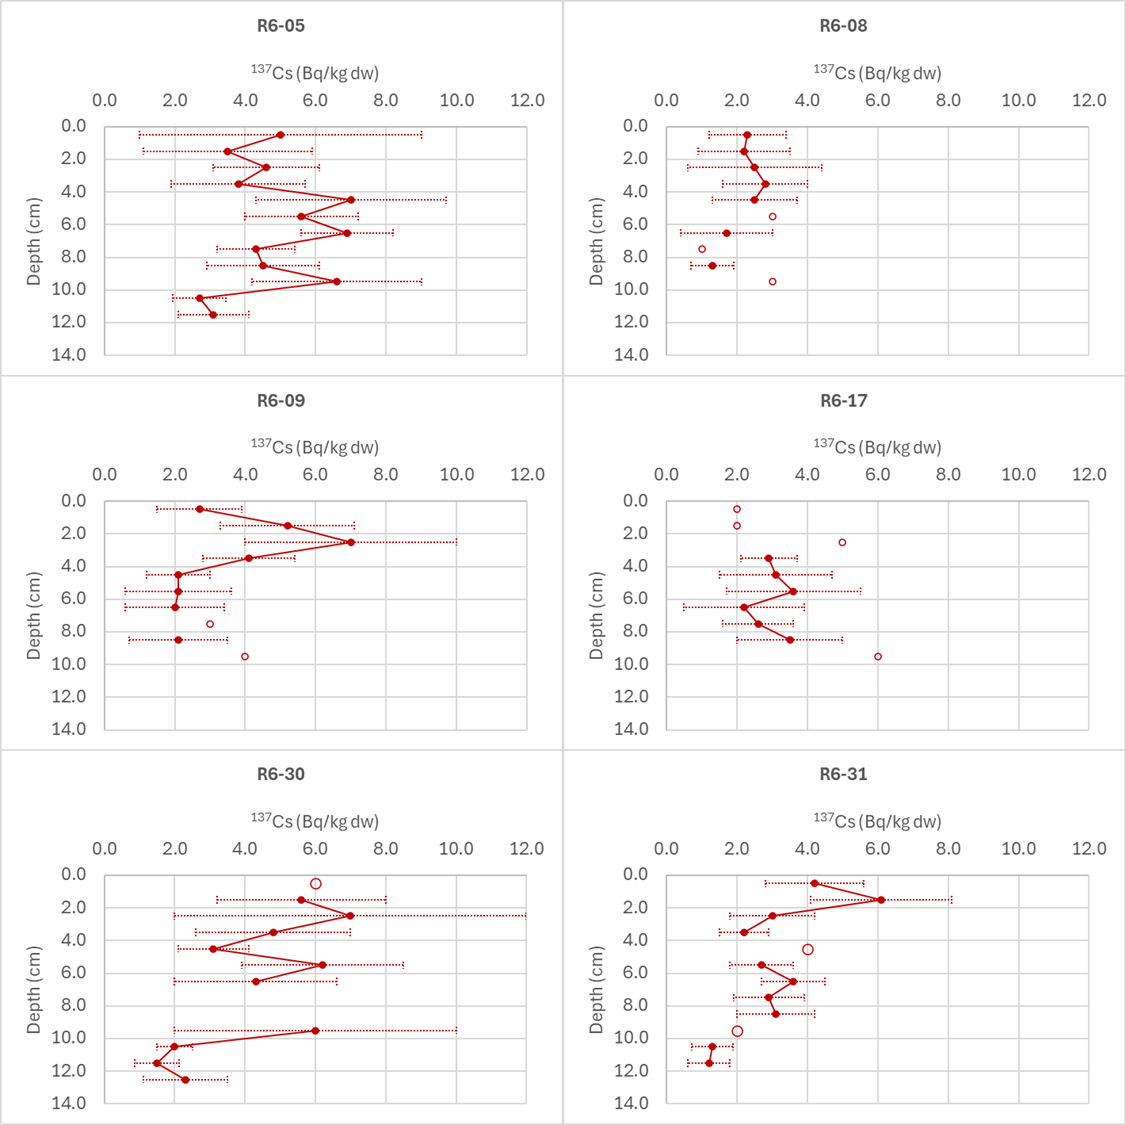
Activity concentrations of 137Cs ranged from below detection limits to 7 Bq kg-1 dw (Figure 20). Analytical uncertainties are high for many of the samples, and most of the profiles do not exhibit clear patterns. One exception is R6-09, which shows a peak in the 2-3 cm layer. This can be used to support results from the 210 Pb-dating.
Figure 20 Activity concentrations of 137Cs (Bq kg-1 dw) in sediment cores collected from Regional stations in Region IV. Activity concentrations below detection limits are shown with open symbols. The detection limit is plotted. Analytical uncertainties are given as ±2σ .
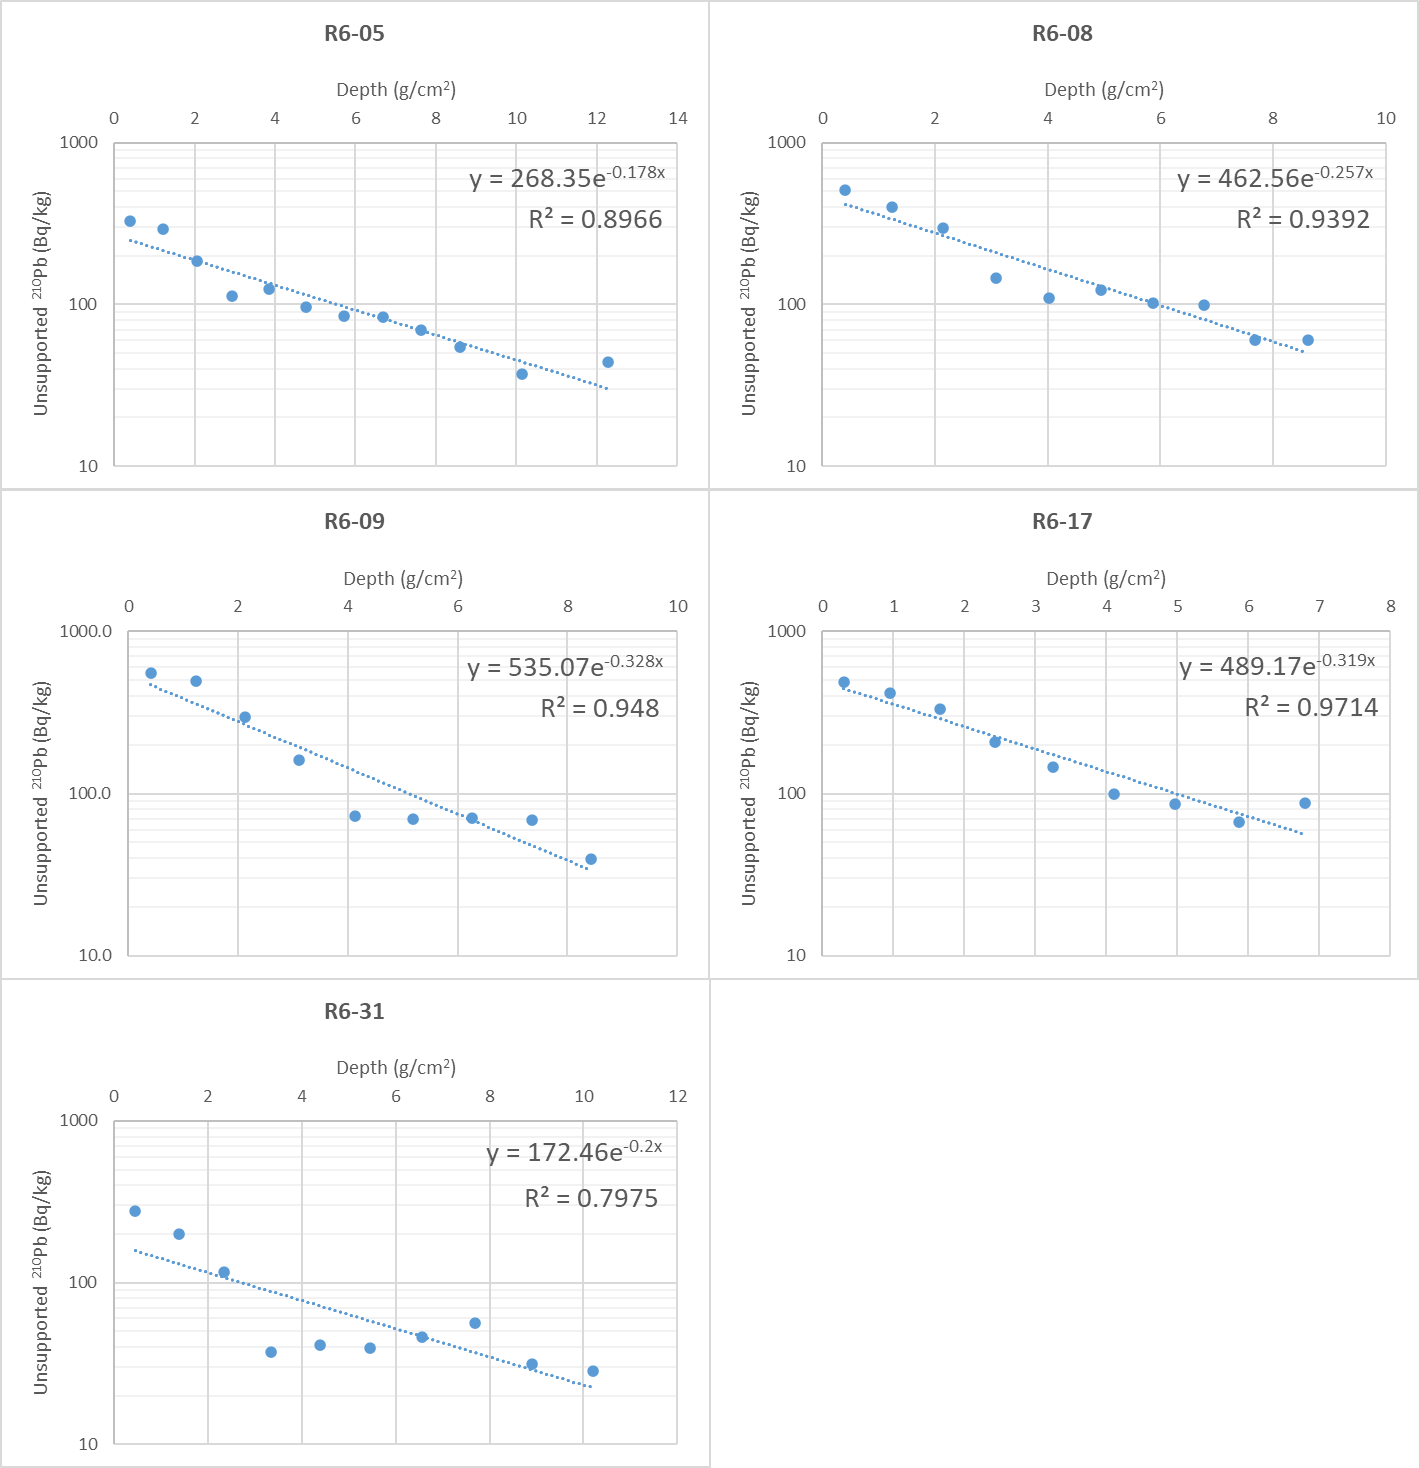
Activity concentrations of 210Pbunsupp in the sediment layers from the cores collected at regional stations in Region VI are plotted against sediment depth (g cm-2) in Figure 21 .
Figure 21 Activity concentrations of 210Pbunsupp (Bq kg-1 dw) in the sediment layers from the core collected at regional stations in Region VI plotted against sediment depth (g cm-2). Sedimentation rates were determined using an exponential curve fit.
The sedimentation rates at stations R6-05, R6-08, R6-09, R6-17 and R631 are calculated according to Equation 1 and given in Table 8. The sedimentation rates calculated for the two different depth parameters are quite consistent. Estimated age of the sediment layers are given in Tables 9-13. Sedimentation rates range from 0.09 to 0.18 g cm-2 y-1.
The core collected at station R6-09has a clear 137Cs-peak in the 2-3 cm layer (Figure 20). Assuming this originates from the Chernobyl accident, this layer can be dated to 1986. This does not quite correspond to the 210Pb-dating, which dates the 3-4 cm layer to 1986, using the volumetric depth parameter. This core deviates somewhat from an exponential decay, which makes the 210 Pb-dating less robust. The latter also applies for the core collected from station R6-31.
Station
Sedimentation rate(cm y-1)
Sedimentation rate (g cm -2 y -1 )
R6-05
0.18
0.17
R6-08
0.13
0.12
R6-09
0.09
0.10
R6-17
0.12
0.10
R6-31
0.14
0.16
Table 8 Sedimentation rates at regional stations in Region VI.
Depth(g cm-2 y-1)
Estimated age(y)
Estimated year
0
0
2024
±
0
0.4
2
2022
±
1
1.2
7
2017
±
1
2.1
12
2012
±
2
2.9
17
2007
±
3
3.8
23
2001
±
5
4.8
28
1996
±
6
5.7
34
1990
±
7
6.7
40
1984
±
8
7.6
45
1979
±
9
8.6
51
1973
±
10
10.2
60
1964
±
12
12.3
73
1951
±
15
Table 9 Estimated age of sediment layers from the sediment core collected at station R6-05 calculated based on the CF:CS method.
Depth(g cm-2 y-1)
Estimated age(y)
Estimated year
0.0
0
2024
±
0
0.4
3
2021
±
1
1.2
10
2014
±
2
2.1
18
2006
±
4
3.1
25
1999
±
5
4.0
33
1991
±
7
4.9
41
1983
±
8
5.9
48
1976
±
10
6.8
56
1968
±
11
7.7
63
1961
±
13
8.6
71
1953
±
14
Table 10 Estimated age of sediment layers from the sediment core collected at station R6-08 calculated based on the CF:CS method.
Depth (g cm-2 y-1)
Estimated age(y)
Estimated year
0
0
2024
±
0
0.4
4
2020
±
1
1.2
13
2011
±
3
2.1
22
2002
±
5
3.1
33
1991
±
8
4.1
43
1981
±
10
5.2
55
1969
±
12
6.3
66
1958
±
14
7.3
77
1947
±
16
8.4
89
1935
±
18
Table 11 Estimated age of sediment layers from the sediment core collected at station R6-09 calculated based on the CF:CS method.
Depth (g cm-2 y-1)
Estimated age(y)
Estimated year
0.0
0
2024
±
0
0.3
3
2021
±
1
0.9
10
2014
±
2
1.7
17
2007
±
3
2.4
25
1999
±
5
3.3
33
1991
±
7
4.1
42
1982
±
8
5.0
51
1973
±
10
5.9
60
1964
±
12
6.8
69
1955
±
14
Table 12 Estimated age of sediment layers from the sediment core collected at station R6-17 calculated based on the CF:CS method.
Depth (g cm-2 y-1)
Estimated age(y)
Estimated year
0.0
0
2024
±
0
0.5
3
2021
±
1
1.4
9
2015
±
2
2.3
15
2009
±
3
3.4
21
2003
±
4
4.4
28
1996
±
6
5.5
35
1989
±
7
6.6
42
1982
±
8
7.7
49
1975
±
10
8.9
57
1967
±
11
10.2
65
1959
±
13
Table 13 Estimated age of sediment layers from the sediment core collected at station R6-31 calculated based on the CF:CS method.
4.2.9 - Activity concentrations vs pelite and TOC in Region II and VI
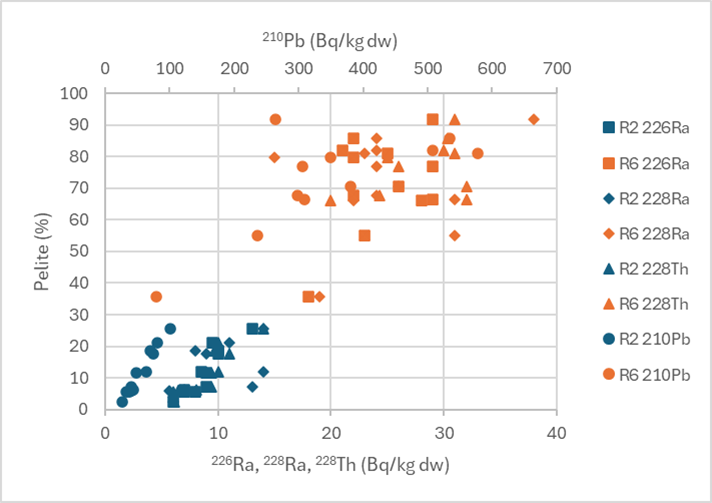
It is well known that grain size affects radionuclide levels in sediments. For instance, He and Walling (1996) show that radionuclides primarily adhere to fine-grained particles due to their larger specific surface area. Activity concentrations of 210Pb, 226Ra, 228Ra and 228 Th are plotted against % pelite (grain size < 0.063 µm) for both Region II and VI in Figure 22 . All samples collected in Region II are classified as “fine sand” (grain size 0.063–0.250 µm) and has corresponding low radionuclide levels. All samples collected in Region VI except a sample from station DRPL24 are classified as “pelite” and have higher radionuclide levels than the samples collected in Region II (Figure 22).
Figure 22 Pelite (%) (grain size < 0.063 µm) plotted against activity concentrations of 210Pb, 226Ra, 228Ra and 228Th (Bq kg-1 dw) in the 0-1 cm sediment layer. Blue=samples collected in Region II, orange=samples collected in Region VI.
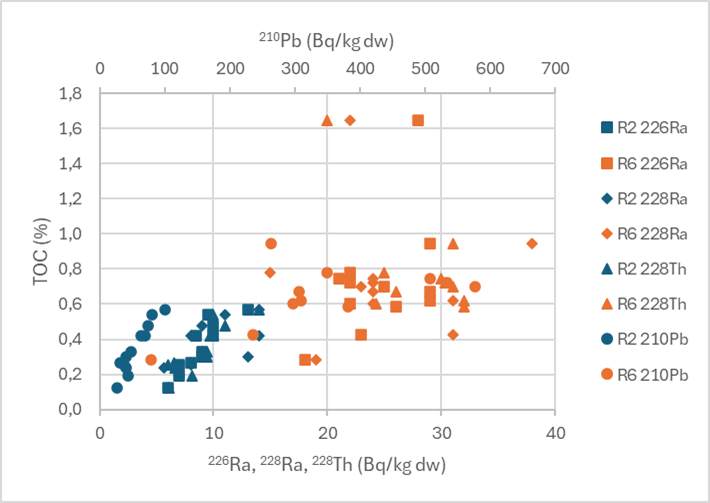
Activity concentrations of 210Pb, 226Ra, 228Ra and 228 Th in the 0-1 cm sediment layer are plotted against TOC (%) in Figure 23 . Again, there is clearly a correlation between the TOC content and activity concentrations. The samples with the lowest TOC content are the ones from Region II with the lowest radionuclide levels. Samples collected in Region VI have somewhat higher TOC levels.
Figure 23 TOC (%) plotted against activity concentrations of 210Pb, 226Ra, 228Ra and 228Th (Bq kg-1 dw) in the 0-1 cm sediment layer. Blue=samples collected in Region II, orange=samples collected in Region VI.
4.2.10 - Activity concentrations vs distance to discharge points in Region II and VI
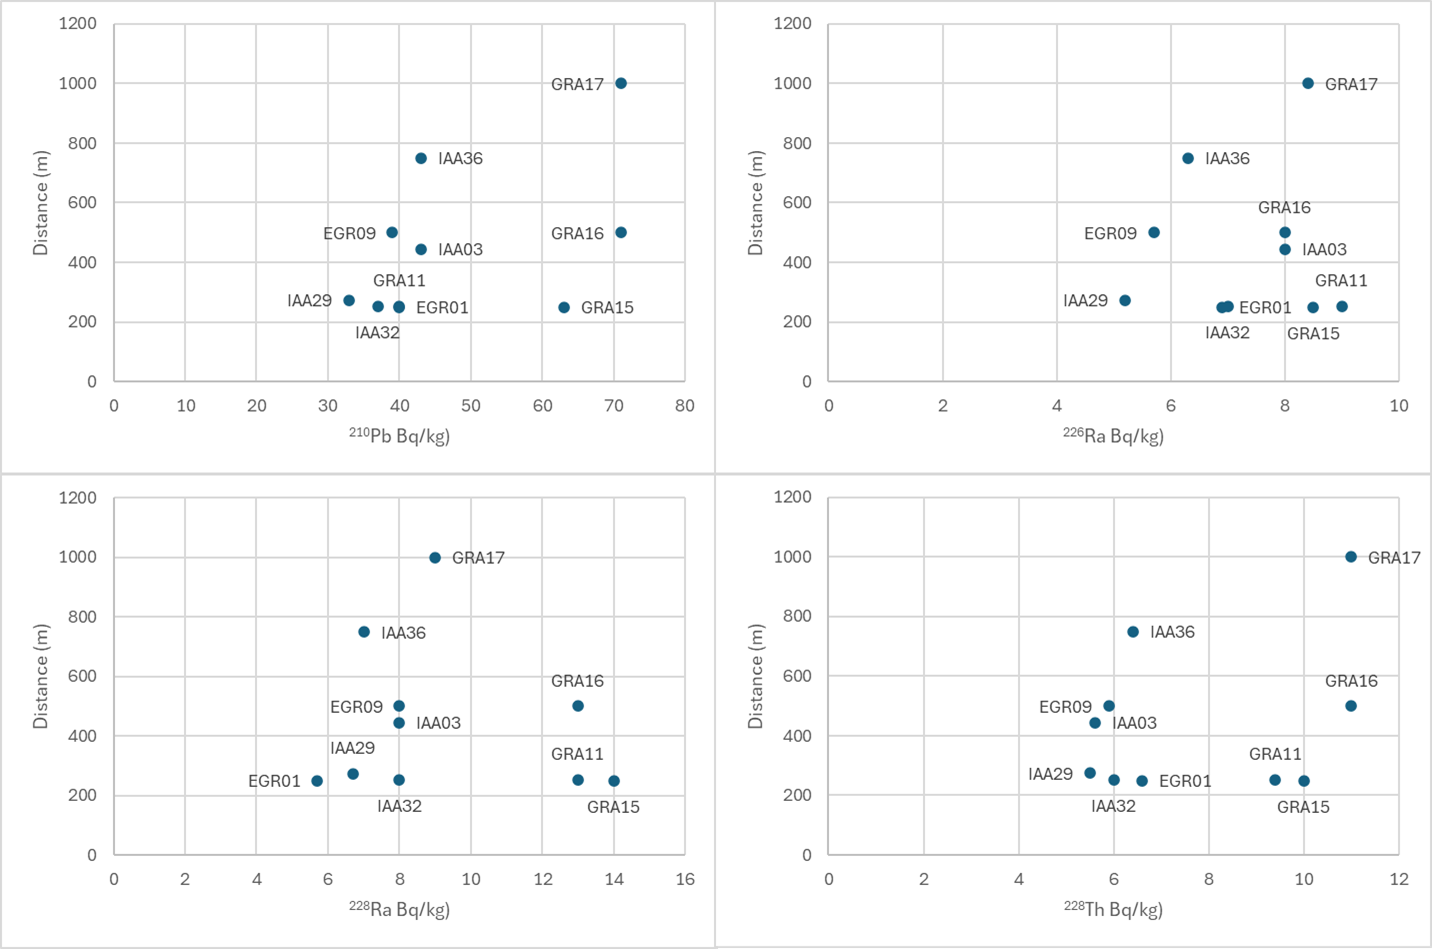
Activity concentrations of 210Pb, 226Ra, 228Ra and 228 Th are plotted against distance from station to discharge point in Region II in Figure 24. The distance from discharge points to stations in Region II varies from 250 to 1000 m. The results do not show elevated activity concentrations at the stations closest to the discharge points.
Figure 24 Activity concentrations (Bq kg-1dw) of 210Pb (upper left), 226Ra (upper right), 228Ra (lower left) and 228Th (lower right) plotted against distance to the main discharge point for the Grane, Edvard Grieg and Ivar Aasen fields in Region II.
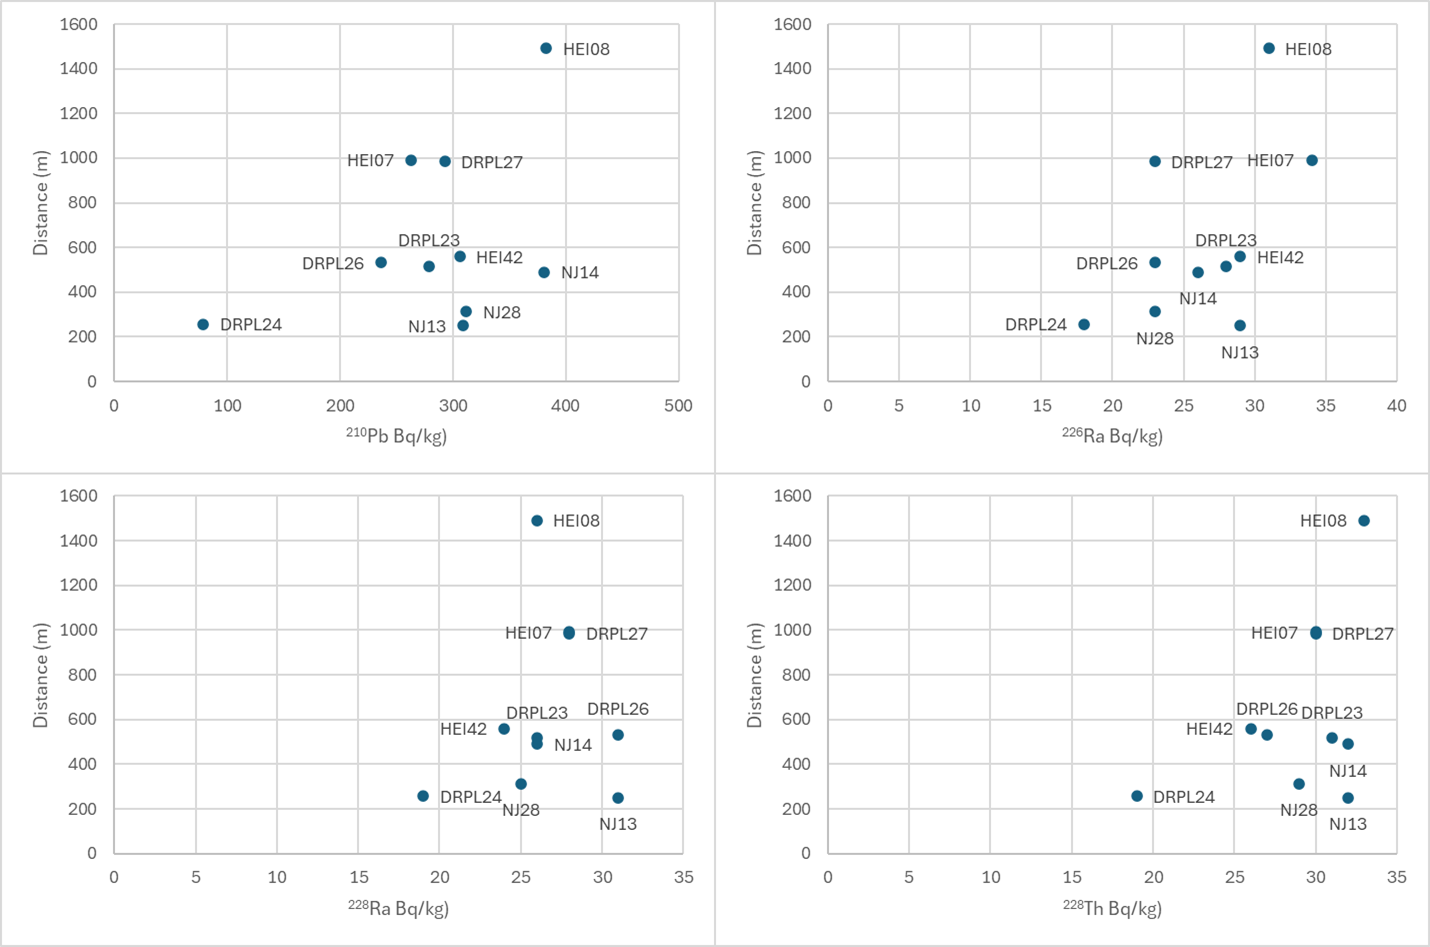
Activity concentrations of 210Pb, 226Ra, 228Ra and 228 Th are plotted against distance from station to discharge point in Region II in Figure 25. The distance from discharge points to stations in Region VI varies from 250 to 1491 m. The results do not show elevated activity concentrations at the stations closest to the discharge points.
Figure 25 Activity concentrations (Bq kg-1dw) of 210Pb (upper left), 226Ra (upper right), 228Ra (lower left) and 228Th (lower right) plotted against distance to the main discharge point for the Draugen, Heidrun and Njord fields in Region VI.
5 - Discussion and conclusions
5.1 - Fish samples
Data on natural radionuclides in muscle and bone tissues from fish in Norwegian marine areas are limited. Since all activity concentrations for the natural radionuclides measured in the current study were below detection limits, meaningful comparisons with existing data are not possible. To obtain more accurate results and enable robust comparisons across different geographical areas, it would be necessary to analyze samples using alpha spectrometry. However, this method is more labor-intensive and expensive. If the primary goal is to document low levels of radionuclides, gamma spectrometry, as used in this study, provides a sufficient approach.
A few relevant studies can be used for rough comparisons, as shown in Table 14. For example, Heldal et al. (2019) report levels of anthropogenic and natural radionuclides in Norwegian farmed salmon (Salmo salar) including analyses of 210Pb, 226Ra and 228Ra. In this study, 210Pb was analysed using alpha spectrometry with activity concentrations ranging from 0.03 to 0.07 Bq kg-1 fw. Both 226Ra and 228 Ra were analysed using gamma spectrometry, and, like the present study, their activity concentrations were below detection limits.
Carvalho et al. (2011) report activity concentrations of a range of anthropogenic and natural radionuclides in deep-sea fish and other organisms from the North Atlantic Ocean. For 226Ra and 210Pb, which were analysed using alpha spectrometry, activity concentrations ranged from 15.6 to 876 and 12 to 200 mBq kg-1 fw, respectively. Two examples from their study, one for a cod sample from the Barents Sea and another for a redfish sample from the Icleand Sea, are included in Table 14 .
Overall, the findings of Heldal et al. (2019) and Carvalho et al. (2011) provide some context for understanding the levels of natural radionuclides in marine organisms. However, the differences in methodologies (alpha vs gamma spectrometry) make direct comparisons challenging.
The results of the present study do not indicate elevated activity concentrations of the natural radionuclides 210Pb, 226Ra and 228Ra in fish caught near the petroleum installations Hywind, Snorre A and Oseberg. There is currently no available data on 228 Th in fish from Norwegian or adjacent marine areas. To draw more definitive conclusions, it would be necessary to achieve lower detection limits and obtain more precise measurements.
It is important to note that the primary dietary contributor to the internal radiation dose in humans from marine organisms is a different naturally occurring radionuclide: polonium-210 (210Po) (e.g. Carvalho et al., 2011; Heldal et al., 2019; Hansen et al., 2022). 210 Po is and alpha emitter and needs to be analysed by alpha spectrometry.
In contrast to the natural radionuclides, there is a wealth of data available for anthropogenic radionuclides, particularly 137Cs. Most of the data in Norwegian marine areas are obtained within Norway's national monitoring programme Radioactivity in the Marine Environment (RAME) (e.g. Skjerdal et al., 2020; Heldal et al., 2015). Activity concentrations of 137Cs found in the present study are comparable to other data. The slightly higher activity concentrations 137 Cs in ling compared to cusc may be due to differences in the size of the fish (see Table 5 ).
Species
210Pb
226Ra
228Ra
137Cs
Reference
Ling (Molva molva)
<0.57-<0.70
<0.13-<0.16
<0.22-<0.28
0.31-0.38
This study
Cusc (Brosme brosme)
<0.61-<0.74
<0.15-<0.18
<0.25-<0.31
0.21-0.25
This study
Farmed atlantic salmon ( Salmo salar )
0.03-0.07a
<0.03-<0.18
<0.06-<0.39
0.05-0.25
Table 3, Heldal et al., 2019
Cod (Gadus morhua)
0.02-0.07a
-
-
-
Table 3, Heldal et al., 2019
Herring (Clupea harangus)
0.06a
-
-
-
Table 3, Heldal et al., 2019
Mackerel (Scomber scombrus)
0.06a
-
-
-
Table 3, Heldal et al., 2019
Cod (Gadus morhua)
-
-
-
0.05-0.39
Skjerdal et al., 2020
Cod ( Gadus morhua ) a,b
0.02a
0.02a
-
0.17
Carvalho et al., 2011
Red fish (Sebastes mentella)a,c
0.2a
0.4a
-
-
Carvalho et al., 2011
a Analysed by alpha spectrometry b One fish caught in the Barents Sea in 2003 c Seven fish caught in the Iceland Sea in 2004
Table 14 Activity concentrations (Bq kg-1 fresh weight (fw)) in muscle in a range of fish species caught in Norwegian or adjacent marine areas.
Conclusions
Activity concentrations of 210Pb, 226Ra, 228Ra and 228 Th in muscle and bone of ling and cusc caught in areas adjacent to Hywind, Snorre A and Oseberg are low. Any potential health risk to consumers of these fish from these areas is negligible.
The findings of the present study do not suggest that fish caught near the petroleum installations at Hywind, Snorre A and Oseberg have elevated activity concentrations of the natural radionuclides 210Pb, 226Ra and 228Ra and 228 Th as a result of produced water discharges.
To enable more robust comparisons and draw firmer conclusions, it is necessary to obtain lower detection limits and more accurate results, particularly through the use of alpha spectrometry.
If the primary goal is to document low levels of natural radionuclides in fish and seafood, gamma spectrometry, as used in this study, provides a sufficient approach.
5.2 - Sediment samples
The activity concentrations of natural radionuclides observed in the present study align with other Norwegian data (e. g. the Mareano program (which measure 226Ra and 210Pb) (www.mareano.no); the national monitoring program Radioactivity in the Marine Environment (RAME) (e.g. Skjerdal et al., 2020) (which measures 210Pb, 226Ra, 228 Ra); Heldal et al., 2021a and b). Additionally, our findings are consistent with previously gathered data from regional sediment monitoring efforts, as documented in the MOD database. Furthermore, the levels found in our study correlate well with those reported for adjacent sea areas (e.g. Ilus et al., 2007 (Baltic Sea); Hosseini et al., 2010 and references therein (European marine areas); Din and Vesterbacka, 2012 (Baltic Sea)).
The results indicate no significant temporal variations in the levels of naturally occurring radionuclides over time at the Grane, Edvard Grieg and Ivar Aasen fields in Region II nor at the Draugen, Heidrun and Njord fields in Region VI. We did not observe any gradient relative to distance from discharge points.
Numerical modelling has demonstrated that PW and the associated naturally occurring radionuclides is rapidly diluted after discharge to the marine environment (e.g. Neff, 2002; NRPA, 2005; Rye et al., 2009; Skancke et al., 2014; Skancke and Norman, 2016). According to Neff (2002), the dilution factor for high-salinity PW discharged to the North Sea may reach a 1000-fold at 1000 m from the discharge point. Despite dilution, pollution may be transported over long distances. Dowdall and Lepland (2012) reported elevated radium levels within the uppermost sediment layers of six out of eight cores collected in the 1990s from the Norwegian Trench, suggesting a possible association with discharges from the petroleum industry. The Norwegian Trench is recognized as a sink for pollution in the North Sea, and we recommend undertaking a dedicated sampling campaign in this area.
It is essential to contextualize radionuclide levels with respect to grain size and total organic carbon (TOC). Without this perspective, one might incorrectly interpret results as indicating higher pollution levels in Region VI compared to II. This raises concern about the effectiveness of the sampling strategy used. Findings from Region II may offer limited insights into potential contamination due to the sandy sediments’ inability to retain pollutants, which can lead to misleading conclusions regarding environmental impact.
To improve our understanding of contamination patterns, it would be beneficial to conduct a comprehensive survey around the study sites, specifically targeting areas with clay-rich sediments near the discharge points, as these locations are likely to be more suitable for sampling. Collecting cores from sandy sediments is likely unproductive, as the results from such samples do not yield useful information regarding contamination levels.
Additionally, downgrading our sampling strategy in these sandy environments is necessary, as we have found that only the core from site REG2-21A is suitable for dating, and many other cores were too short for reliable age estimations. As such, efforts should focus on sites where sediments are more likely to capture and retain relevant contaminants to ensure a more effective assessment of the area's environmental condition.
Utilizing more suitable sampling equipment—such as a box corer instead of a Van Veen grab—and employing longer PVC tubes to obtain longer sediment cores would greatly enhance our sampling efforts.
6 - References
Akvaplan-niva, 2024a. Toktrapport Sedimentundersøkelser i Region II (Sleipner området), 24. mai – 11. juni 2024. Akvaplan-niva AS Rapport: 2024 65413.02.
Akvaplan-niva, 2024b. Toktrapport Sedimentundersøkelser i Region VI (Haltenbanken), 06. april – 24. april 2024. Akvaplan-niva AS Rapport: 2024 65498.02.
Appleby, P.G., Oldfield, F., 1978. The calculation of lead-210 dates assuming a constant rate of supply of unsupported 210Pb to the sediment. Catena 5 (1), 1–8.
Appleby, P.G., Oldfield, F., 1983. The assessment of 210Pb data from sites with varying sediment accumulation rates. Hydrobiologia 103, 29–35.
Appleby, P.G., 2001. Chronostratigraphic techniques in recent sediments. In: Last, W.M., Smol, J.P. (Eds.), Tracking Environmental Change Using Lake Sediments. Volume 1: Basin Analysis, Coring, and Chronological Techniques. Kluwer Academic Publishers, Dordrecht, The Netherlands, pp. 171–203.
Betti, M., Aldave de las Heras, L., Janssens, A., Henrich, E., Hunter, G., Gerchikov, M., Dutton, M., van Weers, A. W., Nielsen, S., Simmonds, J., Bexon, A., Sazykina, T., 2004. Results of the European Commission Marina II Study Part II – effects of discharges of naturally occurring radioactive material. Journal of Environmental radioactivity 74, 255-277.
Binford, M.W., 1990. Calculation and uncertainty analysis of 210Pb dates for PIRLA project lake sediment cores. J. Paleolimnol. 3, 253–267.
Carvalho, F.P., Oliveira, J.M., Malta, M., 2011. Radionuclides in deep-sea fish and other organisms from the North Atlantic Ocean. ICES Journal of Marine Science 68 (2), 333–340.
Cutshall, N.H., Larsen, I.L., Olsen, C.R., 1983. Direct analysis of 210Pb in sediment samples: Self-absorption corrections. Nuclear Instruments and Methods 206, 309-312.
Din, K. S. and P. Vesterbacka, 2012. Radioactivity levels in some sediment samples from Red Sea and Baltic Sea. Radiation Protection Dosimetry 148(1), 101-106.
Eriksen, D. Ø., Sidhu, R., Strålberg, E., Iden, K. I., Hylland, K., Ruus, A., Røyset, O., Berntssen, M. H. G., Rye, H., 2006. Radionuclides in produced water from Norwegian oil and gas installations – concentrations and bioavailability. Czechoslovak Journal of Physics 56, 43-48.
Goldberg, E.D., 1963. Geochronology with lead-210. In: Radioactive dating. Vienna: International Atomic Energy Agency. Symposium Proceedings pp 121-131.
Hansen, V., Mosbech, A., Rigét, F.F., Søgaard-Hansen, J., Bjerregaard, P., Dietz, R., Sonne, C., Asmund, G., Bøknæs, N., Olsen, M., Gustavson, K., Boertmann, D., Fabricius, S.D., Clausen, D.S., Hansen, A.S., 2022. Science of the Total Environment 806, 150508.
He, Q. and Walling, D. E., 1996. Interpreting Particle Size Effects in the Adsorption of 137 Cs and Unsupported 210 Pb by Mineral Soils and Sediments. J. Environ. Radioact. 30 (2), 117-137.
Heldal, H.E., Brungot, A.L., Skjerdal, H., Gäfvert, T., Gwynn, J.P., Sværen, I., Liebig, P.L., Rudjord, A.L., 2015. Radioaktiv forurensning i fisk og Sjømat i perioden 1991-2011. StrålevernRapport 2015:17. Østerås: Statens Strålevern. In Norwegian.
Heldal, H.E., Volynkin, A., Komperød, M., Hannisdal, R., Skjerdal, H., Rudjord, A.L., 2019. Natural and anthropogenic radionuclides in Norwegian farmed Atlantic salmon ( Salmo salar ). Journal of Environmental Radioactivity 205-206, 42-47.
Heldal, H. E., Helvik, L., Haanes, H., Volynkin, A., Jensen, H., Lepland, A., 2021a. Distribution of natural and anthropogenic radionuclides in sediments from the Vefsnfjord, Norway. Mar. Poll. Bull. 172, 112822.
Heldal, H. E., Helvik, L., Appleby, P., Haanes, H., Volynkin, A., Jensen, H., Lepland, A., 2021b. Geochronology of sediment cores from the Vefsnfjord, Norway. Mar. Poll. Bull. 170, 112683.
Hosseini, A., Beresford, N. A., Brown, J. E., Jones, D. G., Phaneuf, M., Thørring, H., Yankovich, T., 2010. Background dose-rates to reference animals and plants arising from exposure to naturally occurring radionuclides in aquatic environments. J. Radiol. Prot. 30, 235-264.
Ilus, E., Mattila, J., Nielsen, S.P., Jakobson, E., Herrmann, J., Graveris, V., Vilimaite- Silobritiene, B., Suplinska, M., Stepanov, A., Lüning, M., 2007. Long-lived radionuclides in the seabed of the Baltic Sea, report of the sediment baseline study of HELCOM MORS-PRO in 2000-2005. In: Baltic Sea Environment Proceedings NO. 110, 44p.
Koide, M., Souter, A., Goldberg, E.D., 1972. Marine geochronology with 210Pb. Earth Planet Sc Lett 14(3), 442-446.
Neff, J.M., 2002. Bioaccumulation in Marine Organisms. Effect of Contaminants from Oil Well Produced Water. Elsevier Science Publishers, Amsterdam, 452 p. https://doi.org/10.1016/B978-008043716-3/50002-6.
Norwegian Ministry of Climate and Environment, 2020. Meld. St. 20 (2019–2020) Report to the Storting (white paper). Norway's integrated ocean management plans Barents Sea–Lofoten area; the Norwegian Sea; and the North Sea and Skagerrak.
NRPA, 2005. Natural Radioactivity in Produced Water from the Norwegian Oil and Gas Industry in 2003. StrålevernRapport 2005:2. Østerås: Norwegian Radiation Protection Authority.
OSPAR, 2022. Modelling and assessment of additional concentrations of NORM in seawater from discharges of produced water from the offshore oil and gas sector in the North-East Atlantic. Publication Number: 925/2022.
Rye, H., Reed, M., Durgut, I., Eriksen D. Ø., Sidhu, R., Strålberg, E., Iden, K. I., Ramsøy, T., Hylland, K., Ruus, A., Røyset, O., Berntsen, M. H. G, 2009. Enhanced levels of 226Ra radiation in sea water and sediments caused by discharges of produced water on the Norwegian Continental Shelf. Radioprotection 44, 53-58.
Skancke, J., Ditlevsen, M. K., Rye, H., 2014. Fate of radium isotope 226 in the sea originating from offshore produced water discharges on the Norwegian continental shelf. SINTEF report 102006037.
Skancke, J., Nordam, T., 2016. Long-term fate of Ra-226 originating from offshore produced water discharges. SINTEF report A27746.
Skjerdal, H., Heldal, H.E., Rand, A., Gwynn, J., Jensen, L.K., Volynkin, A., Haanes, H., Møller, B., Liebig, P.L., Gäfvert, T., 2020. Radioactivity in the Marine Environment 2015, 2016 and 2017. Results from the Norwegian Marine Monitoring Programme RAME. DSA Report 2020:04. Østerås: Norwegian Radiation and Nuclear Safety Authority, 2020.
Turekian, K.K., Nozaki, Y., Benninger, L.K., 1977. Geochemistry of atmospheric radon and radon products. Annu Rev Earth Pl Sc 5, 227-255.
7 - Appendix 1
Appendix 1 Sample information and activity concentrations of 210Pb, 226Ra, 228Ra, 228Th (Bq kg-1 dry weight (dw)), Region II
Location
Station
number
Sample
date
From
cm
To
cm
210Pb
Bq kg-1
226Ra
Bq kg-1
228Ra
Bq kg-1
228Th
Bq kg-1
137Cs
Bq kg-1
Lat
(N)
Lon
(E)
Alu tr.
(g)
Fw
(g)
Dw
(g)
Dry mat.
(%)
Depth
(m)
Degrees
(°)
Distance
(m)
Sample id
Customer marking
E. Grieg
EGR011,2
29.5.24
0
1
40
±
7
7
±
1
6
±
1
7
±
1
<0.48
±
-
58,84
2,25
-
-
-
-
111
10
250
2024-1598/1
-
E. Grieg
EGR011,2
29.5.24
1
3
43
±
9
13
±
2
9
±
3
9
±
2
<0.85
±
-
58,84
2,25
-
-
-
-
111
10
250
2024-1598/2
-
E. Grieg
EGR011,2
29.5.24
3
6
36
±
8
7
±
2
10
±
3
7
±
1
<0.47
±
-
58,84
2,25
-
-
-
-
111
10
250
2024-1598/3
-
E. Grieg
EGR081,2
29.5.24
0
1
32
±
10
8
±
2
<7.99
±
-
7
±
1
<0.93
±
-
58,84
2,25
-
-
-
-
111
190
250
2024-1599/1
-
E. Grieg
EGR081,2
29.5.24
1
3
38
±
6
8
±
2
7
±
2
7
±
1
<0.52
±
-
58,84
2,25
-
-
-
-
111
190
250
2024-1599/2
-
E. Grieg
EGR081,2
29.5.24
3
6
35
±
7
8
±
2
7
±
2
7
±
1
1
±
0,4
58,84
2,25
-
-
-
-
111
190
250
2024-1599/3
-
E. Grieg
EGR091
29.5.24
0
1
39
±
9
6
±
2
8
±
2
6
±
1
<0.66
±
-
58,84
2,25
-
-
-
-
111
190
500
2024-1436/1
P240114-43
E. Grieg
EGR091
29.5.24
1
3
34
±
6
8
±
2
7
±
2
6
±
1
<0.43
±
-
58,84
2,25
-
-
-
-
111
190
500
2024-1436/2
P240114-44
E. Grieg
EGR091
29.5.24
3
6
43
±
8
8
±
2
11
±
3
8
±
1
<0.75
±
-
58,84
2,25
-
-
-
-
111
190
500
2024-1436/3
P240114-45
E. Grieg
EGR101
29.5.24
0
1
30
±
6
6
±
2
<1.81
±
-
6
±
1
<0.36
±
-
58,83
2,24
-
-
-
-
111
190
1000
2024-1438/1
P240114-46
E. Grieg
EGR101
29.5.24
1
3
43
±
6
7
±
1
8
±
2
6
±
1
<0.41
±
-
58,83
2,24
-
-
-
-
111
190
1000
2024-1438/2
P240114-47
E. Grieg
EGR101
29.5.24
3
6
43
±
6
7
±
1
9
±
2
7
±
1
<0.30
±
-
58,83
2,24
-
-
-
-
111
190
1000
2024-1438/3
P240114-48
E. Grieg
EGR081
29.5.24
0
1
37
±
8
6
±
2
5
±
2
6
±
1
<0.45
±
-
58,84
2,25
4,86
140,3
105,9
74,60
111
190
250
2024-1550/1
P240114-41+42
E. Grieg
EGR081
29.5.24
1
2
41
±
7
6
±
2
5
±
2
6
±
1
<0.69
±
-
58,84
2,25
4,86
149,3
116,7
77,43
111
190
250
2024-1550/2
P240114-41+42
E. Grieg
EGR081
29.5.24
2
3
35
±
11
6
±
2
10
±
4
6
±
1
<0.72
±
-
58,84
2,25
4,86
171,0
134,4
77,97
111
190
250
2024-1550/3
P240114-41+42
E. Grieg
EGR081
29.5.24
3
4
45
±
11
6
±
2
6
±
3
7
±
1
<0.64
±
-
58,84
2,25
4,86
153,7
121,6
78,43
111
190
250
2024-1550/4
P240114-41+42
E. Grieg
EGR081
29.5.24
4
5
37
±
12
7
±
2
9
±
4
8
±
2
<1.09
±
-
58,84
2,25
4,86
161,8
129,8
79,61
111
190
250
2024-1550/5
P240114-41+42
E. Grieg
EGR081
29.5.24
5
6
35
±
7
9
±
2
7
±
3
7
±
1
<0.52
±
-
58,84
2,25
4,86
163,7
131,2
79,54
111
190
250
2024-1550/6
P240114-41+42
E. Grieg
EGR081
29.5.24
6
7
25
±
6
7
±
2
11
±
2
8
±
1
0
±
0,2
58,84
2,25
2,43
62,0
49,4
78,85
111
190
250
2024-1550/7
P240114-41+42
Grane
GRA113
31.5.24
0
1
40
±
7
9
±
1,7
13
±
3
9,4
±
1,5
<0.50
±
-
59,16
2,48
-
-
-
-
130
208
253
2024-1403/1
P240114-15
Grane
GRA111
31.5.24
1
3
43
±
13
8
±
2
8
±
3
10
±
1,8
<0.72
±
-
59,16
2,48
-
-
-
-
130
208
253
2024-1403/2
P240114-16
Grane
GRA111
31.5.24
3
6
27
±
6
13
±
2
13
±
3
13
±
2
<0.49
±
-
59,16
2,48
-
-
-
-
130
208
253
2024-1403/3
P240114-17
Grane
GRA151
31.5.24
0
1
63
±
9
8,5
±
1,8
14
±
3
10
±
1,6
<0.45
±
-
59,17
2,49
-
-
-
-
129
20
250
2024-1404/1
P240114-18
Grane
GRA151
31.5.24
1
3
59
±
14
11
±
2
10
±
3
10
±
1,8
<0.72
±
-
59,17
2,49
-
-
-
-
129
20
250
2024-1404/2
P240114-19
Grane
GRA151
31.5.24
3
6
44
±
9
10
±
2
12
±
3
11
±
1,8
<0.71
±
-
59,17
2,49
-
-
-
-
129
20
250
2024-1404/3
P240114-20
Grane
GRA161
31.5.24
0
1
71
±
11
8
±
2
13
±
3
11
±
1,7
<0.53
±
-
59,17
2,49
-
-
-
-
129
20
500
2024-1405/1
P240114-21
Grane
GRA161
31.5.24
1
3
62
±
8
9,7
±
1,7
9
±
2
9,7
±
1,5
<0.41
±
-
59,17
2,49
-
-
-
-
129
20
500
2024-1405/2
P240114-22
Grane
GRA161
31.5.24
3
6
64
±
11
<2.01
±
-
14
±
4
11
±
1,8
<0.88
±
-
59,17
2,49
-
-
-
-
129
20
500
2024-1405/3
P240114-23
Grane
GRA171
31.5.24
0
1
71
±
10
8,4
±
1,9
9
±
3
11
±
1,7
<0.61
±
-
59,17
2,49
-
-
-
-
130
20
1000
2024-1407/1
P240114-24
Grane
GRA171
31.5.24
1
3
72
±
10
9,5
±
1,9
11
±
3
10
±
1,6
<0.88
±
-
59,17
2,49
-
-
-
-
130
20
1000
2024-1407/2
P240114-25
Grane
GRA171
31.5.24
3
6
63
±
9
11
±
1,8
12
±
3
12
±
1,9
<0.91
±
-
59,17
2,49
-
-
-
-
130
20
1000
2024-1407/3
P240114-26
I. Aasen
IAA031
29.5.24
0
1
43
±
8
8
±
2
8
±
2
5,6
±
1
<0.59
±
-
58,92
2,20
-
-
-
-
115
108
445
2024-1413/1
P240114-27
I. Aasen
IAA031
29.5.24
1
3
43
±
7
5,7
±
1,5
7
±
2
6,4
±
1,1
<0.37
±
-
58,92
2,20
-
-
-
-
115
108
445
2024-1413/2
P240114-28
I. Aasen
IAA031
29.5.24
3
6
42
±
10
7,2
±
1,7
<2.85
±
-
7,2
±
1,2
<0.56
±
-
58,92
2,20
-
-
-
-
115
108
445
2024-1413/3
P240114-29
I. Aasen
IAA291,4
29.5.24
0
1
33
±
7
5,2
±
1,6
6,7
±
2
5,5
±
0,92
<0.39
±
-
58,92
2,19
-
-
-
-
115
289
274
2024-1414/1
P240114-30
I. Aasen
IAA291,4
29.5.24
1
3
33
±
6
6,6
±
1,6
6
±
2
5,2
±
0,92
<0.55
±
-
58,92
2,19
-
-
-
-
115
289
274
2024-1414/2
P240114-31
I. Aasen
IAA291,4
29.5.24
3
6
34
±
7
7,8
±
1,7
6,7
±
2
6,6
±
1,1
<0.63
±
-
58,92
2,19
-
-
-
-
115
289
274
2024-1414/3
P240114-32
I. Aasen
IAA321
29.5.24
0
1
37
±
8
7
±
2
8
±
2
6
±
1
<0.52
±
-
58,92
2,20
-
-
-
-
115
102
253
2024-1415/1
P240114-33
I. Aasen
IAA323
29.5.24
1
3
42
±
9
8,9
±
1,9
9
±
2
6,9
±
1,2
<0.48
±
-
58,92
2,20
-
-
-
-
115
102
253
2024-1415/2
P240114-34
I. Aasen
IAA321
29.5.24
3
6
32
±
7
8,2
±
1,5
8
±
3
6,5
±
1,1
<0.58
±
-
58,92
2,20
-
-
-
-
115
102
253
2024-1415/3
P240114-35
I. Aasen
IAA361
29.5.24
0
1
43
±
6
6,3
±
1,2
7
±
1,5
6,4
±
0,98
0,39
±
0,23
58,92
2,21
-
-
-
-
116
108
750
2024-1416/1
P240114-36
I. Aasen
IAA361
29.5.24
1
3
44
±
8
6,5
±
1,6
8
±
3
6,6
±
1,1
<0.56
±
-
58,92
2,21
-
-
-
-
116
108
750
2024-1416/2
P240114-37
I. Aasen
IAA361
29.5.24
3
6
48
±
12
6
±
3
<4.95
±
-
6
±
1,3
<0.77
±
-
58,92
2,21
-
-
-
-
116
108
750
2024-1416/3
P240114-38
I. Aasen
IAA321
29.5.24
0
1
38
±
7
8,1
±
1,7
5
±
2
6,4
±
1,1
<0.65
±
-
58,92
2,20
4,86
183,7
145,7
78,75
115
102
253
2024-1549/1
P240114-39+40
I. Aasen
IAA321
29.5.24
1
2
40
±
10
7
±
2
9
±
3
6,6
±
1,3
<0.87
±
-
58,92
2,20
4,86
155,4
123,7
78,94
115
102
253
2024-1549/2
P240114-39+40
I. Aasen
IAA321
29.5.24
2
3
44
±
11
8
±
2
8
±
4
7,7
±
1,6
<1.60
±
-
58,92
2,20
4,86
160,6
127,9
79,00
115
102
253
2024-1549/3
P240114-39+40
I. Aasen
IAA321
29.5.24
3
4
40
±
7
7,1
±
1,8
6
±
2
6,9
±
1,2
<0.78
±
-
58,92
2,20
4,86
159,0
127,1
79,30
115
102
253
2024-1549/4
P240114-39+40
I. Aasen
IAA321
29.5.24
4
5
35
±
6
8,3
±
1,8
6
±
3
7,1
±
1,2
<0.73
±
-
58,92
2,20
4,86
123,6
98,2
78,61
115
102
253
2024-1549/5
P240114-39+40
I. Aasen
IAA321
29.5.24
5
6
29
±
5
7,5
±
2
6
±
2
6,3
±
1,1
<0.42
±
-
58,92
2,20
2,43
75,2
60,1
79,25
115
102
253
2024-1549/6
P240114-39+40
I. Aasen
IAA321
29.5.24
6
7
44
±
8
<2.01
±
-
16
±
4
7,8
±
1,6
<0.95
±
-
58,92
2,20
2,43
24,1
19,5
78,77
115
102
253
2024-1549/7
P240114-39+40
Regional
REG2-08A1
26.5.24
0
1
48
±
10
9
±
3
9
±
3
9,4
±
1,7
<1.22
±
-
58,75
1,67
4,86
162,9
121,9
74,1
109
-
-
2024-1542/1
P240114-01+02
Regional
REG2-08A1
26.5.24
1
2
53
±
11
9
±
2
9
±
3
9,7
±
1,7
<0.75
±
-
58,75
1,67
4,86
158,1
123,0
77,1
109
-
-
2024-1542/2
P240114-01+02
Regional
REG2-08A1
26.5.24
2
3
52
±
8
8,8
±
1,8
9
±
3
9,9
±
1,6
<0.41
±
-
58,75
1,67
4,86
161,5
126,4
77,6
109
-
-
2024-1542/3
P240114-01+02
Regional
REG2-08A1
26.5.24
3
4
42
±
5
10
±
1,4
8
±
2
9,6
±
1,4
0,31
±
0,17
58,75
1,67
4,86
155,4
122,4
78,1
109
-
-
2024-1542/4
P240114-01+02
Regional
REG2-08A1
26.5.24
4
5
44
±
8
12
±
2
12
±
3
10
±
1,6
<0.53
±
-
58,75
1,67
4,86
158,9
125,7
78,4
109
-
-
2024-1542/5
P240114-01+02
Regional
REG2-08A1
26.5.24
5
6
39
±
6
10
±
1,7
12
±
3
10
±
1,5
0,57
±
0,27
58,75
1,67
4,86
154,1
121,6
78,2
109
-
-
2024-1542/6
P240114-01+02
Regional
REG2-08A1
26.5.24
6
7
28
±
10
13
±
3
15
±
4
12
±
2
0,83
±
0,52
58,75
1,67
2,43
29,6
23,8
78,7
109
-
-
2024-1542/7
P240114-01+02
Regional
REG2-17A1
25.5.24
0
1
27
±
6
6
±
1,4
6
±
1,9
6,1
±
1
<0.42
±
-
58,39
2,00
4,86
156,7
127,1
80,5
78
-
-
2024-1543/1
P240114-03+04
Regional
REG2-17A1
25.5.24
1
2
32
±
7
8,3
±
1,6
6
±
2
7,4
±
1,2
<0.52
±
-
58,39
2,00
4,86
158,9
130,5
81,6
78
-
-
2024-1543/2
P240114-03+04
Regional
REG2-17A1
25.5.24
2
3
31
±
6
9,9
±
1,7
8
±
2
9,1
±
1,4
<0.64
±
-
58,39
2,00
4,86
174,2
143,4
81,8
78
-
-
2024-1543/3
P240114-03+04
Regional
REG2-17A1
25.5.24
3
4
32
±
6
9,7
±
1,6
6,6
±
1,8
8
±
1,3
<0.44
±
-
58,39
2,00
4,86
146,2
120,7
82,0
78
-
-
2024-1543/4
P240114-03+04
Regional
REG2-17A1
25.5.24
4
5
29
±
6
8,8
±
1,7
11
±
2
7,6
±
1,2
<0.56
±
-
58,39
2,00
2,43
67,5
55,1
80,9
78
-
-
2024-1543/5
P240114-03+04
Regional
REG2-17A1
25.5.24
5
6
37
±
6
12
±
3
14
±
3
9,6
±
1,5
<0.60
±
-
58,39
2,00
2,43
36,6
29,5
79,2
78
-
-
2024-1543/6
P240114-03+04
Regional
REG2-20A1
30.5.24
0
1
74
±
10
10
±
1,8
9
±
3
11
±
1,7
<0.58
±
-
59,13
2,46
4,86
137,3
101,6
73,0
128
-
-
2024-1544/1
P240114-05+06
Regional
REG2-20A1
30.5.24
1
2
81
±
10
11
±
2
12
±
4
12
±
1,9
<0.66
±
-
59,13
2,46
4,86
140,7
105,4
74,0
128
-
-
2024-1544/2
P240114-05+06
Regional
REG2-20A1
30.5.24
2
3
80
±
11
10
±
1,9
9
±
3
11
±
1,8
<0.48
±
-
59,13
2,46
4,86
151,1
115,2
75,5
128
-
-
2024-1544/3
P240114-05+06
Regional
REG2-20A1
30.5.24
3
4
71
±
8
11
±
1,6
10
±
2
11
±
1,7
0,51
±
0,2
59,13
2,46
4,86
151,8
116,9
76,2
128
-
-
2024-1544/4
P240114-05+06
Regional
REG2-20A1
30.5.24
4
5
74
±
10
12
±
2
12
±
3
12
±
1,9
<0.85
±
-
59,13
2,46
4,86
162,4
126,0
76,9
128
-
-
2024-1544/5
P240114-05+06
Regional
REG2-20A1
30.5.24
5
6
62
±
13
12
±
3
12
±
4
12
±
2
<1.09
±
-
59,13
2,46
4,86
159,9
124,9
77,4
128
-
-
2024-1544/6
P240114-05+06
Regional
REG2-20A1
30.5.24
6
7
60
±
12
13
±
3
13
±
4
12
±
2
<1.05
±
-
59,13
2,46
4,86
168,2
131,9
77,8
128
-
-
2024-1544/7
P240114-05+06
Regional
REG2-20A1
30.5.24
7
8
50
±
12
13
±
3
15
±
4
13
±
2
<0.94
±
-
59,13
2,46
4,86
159,0
125,0
77,9
128
-
-
2024-1544/8
P240114-05+06
Regional
REG2-20A1
30.5.24
8
9
48
±
7
13
±
2
18
±
4
14
±
2
0,7
±
0,43
59,13
2,46
2,43
59,8
47,1
77,9
128
-
-
2024-1544/9
P240114-05+06
Regional
REG2-21A1
1.6.24
0
1
101
±
11
13
±
1,8
14
±
3
14
±
2
<0.47
±
-
59,45
2,16
4,86
129,6
86,3
65,3
127
-
-
2024-1545/1
P240114-07+08
Regional
REG2-21A1
1.6.24
1
2
104
±
11
14
±
1,9
16
±
3
15
±
2
0,46
±
0,25
59,45
2,16
4,86
135,4
94,0
68,3
127
-
-
2024-1545/2
P240114-07+08
Regional
REG2-21A1
1.6.24
2
3
95
±
10
14
±
1,9
15
±
3
13
±
2
<0.50
±
-
59,45
2,16
4,86
131,0
93,5
70,3
127
-
-
2024-1545/3
P240114-07+08
Regional
REG2-21A1
1.6.24
3
4
89
±
11
14
±
2
12
±
3
14
±
2
0,91
±
0,44
59,45
2,16
4,86
155,1
113,2
72,1
127
-
-
2024-1545/4
P240114-07+08
Regional
REG2-21A1
1.6.24
4
5
83
±
12
13
±
2
16
±
4
14
±
2
0,89
±
0,5
59,45
2,16
4,86
140,3
104,1
73,3
127
-
-
2024-1545/5
P240114-07+08
Regional
REG2-21A1
1.6.24
5
6
73
±
9
14
±
1,9
17
±
3
13
±
2
0,52
±
0,28
59,45
2,16
4,86
152,5
114,4
74,2
127
-
-
2024-1545/6
P240114-07+08
Regional
REG2-21A1
1.6.24
6
7
64
±
10
14
±
2
16
±
4
14
±
2
<0.80
±
-
59,45
2,16
4,86
159,3
120,8
75,1
127
-
-
2024-1545/7
P240114-07+08
Regional
REG2-21A1
1.6.24
7
8
54
±
10
15
±
2
15
±
4
13
±
2
<0.72
±
-
59,45
2,16
4,86
158,8
121,1
75,5
127
-
-
2024-1545/8
P240114-07+08
Regional
REG2-21A1
1.6.24
8
9
48
±
8
12
±
2
14
±
3
13
±
2
<0.58
±
-
59,45
2,16
4,86
143,1
108,9
75,3
127
-
-
2024-1545/9
P240114-07+08
Regional
REG2-21A1
1.6.24
9
10
47
±
8
13
±
3
20
±
4
15
±
2
<0.67
±
-
59,45
2,16
2,43
30,20
23,3
75,2
127
-
-
2024-1545/10
P240114-07+08
Regional
REG2-22A1
2.6.24
0
1
81
±
11
9,5
±
1,9
11
±
3
10
±
1,6
0,58
±
0,35
59,66
2,23
4,86
117,1
80,6
67,5
116
-
-
2024-1546/1
P240114-09+10
Regional
REG2-22A1
2.6.24
1
2
90
±
13
9
±
2
13
±
3
10
±
1,7
<0.65
±
-
59,66
2,23
4,86
157,4
115,4
72,5
116
-
-
2024-1546/2
P240114-09+10
Regional
REG2-22A1
2.6.24
2
3
104
±
11
11
±
1,6
12
±
2
11
±
1,7
<0.48
±
-
59,66
2,23
4,86
148,4
108,1
71,9
116
-
-
2024-1546/3
P240114-09+10
Regional
REG2-22A1
2.6.24
3
4
93
±
10
12
±
1,8
12
±
2
11
±
1,7
<0.36
±
-
59,66
2,23
4,86
154,9
114,4
73,0
116
-
-
2024-1546/4
P240114-09+10
Regional
REG2-22A1
2.6.24
4
5
97
±
11
11
±
1,6
13
±
2
11
±
1,7
0,55
±
0,29
59,66
2,23
4,86
161,2
121,0
74,3
116
-
-
2024-1546/5
P240114-09+10
Regional
REG2-22A1
2.6.24
5
6
88
±
11
12
±
2
14
±
3
12
±
1,8
0,99
±
0,49
59,66
2,23
4,86
158,0
119,4
74,8
116
-
-
2024-1546/6
P240114-09+10
Regional
REG2-22A1
2.6.24
6
7
78
±
9
12
±
1,7
15
±
3
13
±
1,9
<0.51
±
-
59,66
2,23
4,86
144,6
110,1
75,3
116
-
-
2024-1546/7
P240114-09+10
Regional
REG2-22A1
2.6.24
7
8
61
±
7
12
±
1,7
13
±
2
11
±
1,6
0,63
±
0,3
59,66
2,23
4,86
166,3
130,0
77,5
116
-
-
2024-1546/8
P240114-09+10
Regional
REG2-22A1
2.6.24
8
9
56
±
10
12
±
2
14
±
3
11
±
1,8
<0.61
±
-
59,66
2,23
4,86
174,5
137,1
78,0
116
-
-
2024-1546/9
P240114-09+10
Regional
REG2-281
10.6.24
0
1
44
±
8
7
±
2
7
±
3
8,1
±
1,4
<0.78
±
-
60,03
2,40
4,86
104,0
85,0
80,8
110
-
-
2024-1547/1
P240114-11+12
Regional
REG2-281
10.6.24
1
2
40
±
6
7,4
±
1,8
6
±
2
7,5
±
1,2
<0.41
±
-
60,03
2,40
4,86
109,8
90,3
81,4
110
-
-
2024-1547/2
P240114-11+12
Regional
REG2-281
10.6.24
2
3
41
±
10
7
±
2
8
±
3
7,9
±
1,5
<0.57
±
-
60,03
2,40
4,86
112,2
92,5
81,6
110
-
-
2024-1547/3
P240114-11+12
Regional
REG2-281
10.6.24
3
4
49
±
8
11
±
2
5
±
3
8,3
±
1,4
<0.50
±
-
60,03
2,40
4,86
112,7
92,9
81,6
110
-
-
2024-1547/4
P240114-11+12
Regional
REG2-281
10.6.24
4
5
50
±
10
9
±
3
7
±
4
8,3
±
1,5
<0.75
±
-
60,03
2,40
4,86
115,3
94,8
81,4
110
-
-
2024-1547/5
P240114-11+12
Regional
REG2-281
10.6.24
5
6
48
±
8
11
±
2
8
±
3
8,7
±
1,5
<0.86
±
-
60,03
2,40
4,86
107,0
87,8
81,2
110
-
-
2024-1547/6
P240114-11+12
Regional
REG2-361
31.5.24
0
1
70
±
12
10
±
3
8
±
3
9,7
±
1,7
<1.11
±
-
59,25
2,28
4,86
139,9
103,4
73,0
127
-
-
2024-1548/1
P240114-13+14
Regional
REG2-361
31.5.24
1
2
71
±
11
9,4
±
1,8
8
±
3
10
±
1,6
<0.56
±
-
59,25
2,28
4,86
145,3
110,7
75,4
127
-
-
2024-1548/2
P240114-13+14
Regional
REG2-361
31.5.24
2
3
70
±
12
10
±
3
12
±
4
10
±
1,8
<1.12
±
-
59,25
2,28
4,86
156,8
120,1
75,8
127
-
-
2024-1548/3
P240114-13+14
Regional
REG2-361
31.5.24
3
4
51
±
14
11
±
3
14
±
5
10
±
1,8
<1.02
±
-
59,25
2,28
4,86
156,6
120,5
76,2
127
-
-
2024-1548/4
P240114-13+14
Regional
REG2-361
31.5.24
4
5
73
±
9
11
±
1,9
9
±
3
11
±
1,7
0,58
±
0,34
59,25
2,28
4,86
157,1
121,1
76,4
127
-
-
2024-1548/5
P240114-13+14
Regional
REG2-361
31.5.24
5
6
68
±
10
11
±
1,9
12
±
3
12
±
1,8
<0.56
±
-
59,25
2,28
4,86
158,7
121,6
75,9
127
-
-
2024-1548/6
P240114-13+14
Regional
REG2-361
31.5.24
6
7
56
±
9
13
±
2
12
±
3
11
±
1,7
<0.63
±
-
59,25
2,28
4,86
120,7
92,7
75,8
127
-
-
2024-1548/7
P240114-13+14
Regional
REG2-361
31.5.24
7
8
59
±
12
16
±
6
26
±
7
13
±
3
<1.47
±
-
59,25
2,28
2,43
14,7
11,7
75,6
127
-
-
2024-1548/8
P240114-13+14
1Pb210 and Th228 results are not accredited.
2These samples do not harve serial numbers.
3Not accredited. The sample has been diluted with silica due to small sample size.
4New station name IAA37
8 - Appendix 2
Appendix 2 Sample information and activity concentrations of 210Pb, 226Ra, 228Ra, 228Th (Bq kg-1 dry weight (dw)), Region VI
Location
Station
number
Sample
date
From
cm
To
cm
210Pb
Bq kg-1
226Ra
Bq kg-1
228Ra
Bq kg-1
228Th
Bq kg-1
137Cs
Bq kg-1
Lat
(N)
Lon
(E)
Alu tray
(g)
Fw
(g)
Dw
(g)
Dry mat.
(%)
Depth
(m)
Degrees
(°)
Distance
(m)
Sample id
Customer marking
Heidrun
HEI071
12.4.24
0
1
263
±
26
34
±
4
28
±
5
30
±
4
1,0
±
0,3
65,33
7,33
-
-
-
-
353
47
992
2024-1028/13
P240059-13
Heidrun
HEI071
12.4.24
1
3
221
±
23
30
±
3
30
±
5
29
±
4
1,2
±
0,4
65,33
7,33
-
-
-
-
353
47
992
2024-1028/14
P240059-14
Heidrun
HEI071
12.4.24
3
6
87
±
12
26
±
3
28
±
5
28
±
4
1,3
±
0,4
65,33
7,33
-
-
-
-
353
47
992
2024-1028/15
P240059-15
Heidrun
HEI081
12.4.24
0
1
383
±
36
31
±
3
26
±
5
33
±
5
2,5
±
0,4
65,34
7,34
-
-
-
-
351
47
1491
2024-1028/16
P240059-16
Heidrun
HEI081
12.4.24
1
3
178
±
18
29
±
3
30
±
5
29
±
4
2,7
±
0,5
65,34
7,34
-
-
-
-
351
47
1491
2024-1028/17
P240059-17
Heidrun
HEI081
12.4.24
3
6
65
±
8
26
±
3
30
±
5
29
±
4
1,1
±
0,3
65,34
7,34
-
-
-
-
351
47
1491
2024-1028/18
P240059-18
Heidrun
HEI421
11.4.24
0
1
306
±
35
29
±
4
24
±
5
26
±
4
1,3
±
0,5
65,32
7,31
-
-
-
-
342
225
559
2024-1028/19
P240059-19
Heidrun
HEI421
11.4.24
1
3
196
±
19
27
±
3
28
±
5
25
±
4
2,0
±
0,4
65,32
7,31
-
-
-
-
342
225
559
2024-1028/20
P240059-20
Heidrun
HEI421
11.4.24
3
6
93
±
15
26
±
4
29
±
6
28
±
4
1,5
±
0,7
65,32
7,31
-
-
-
-
342
225
559
2024-1028/21
P240059-21
Heidrun
HEI472
11.4.24
0
1
-
-
28
±
4
22
±
4
20
±
3
<0.85
-
65,33
7,32
-
-
-
-
350
45
350
2024-1028/22
P240059-22
Heidrun
HEI472
11.4.24
1
3
-
-
33
±
4
25
±
6
22
±
3
<0.67
-
65,33
7,32
-
-
-
-
350
45
350
2024-1028/23
P240059-23
Heidrun
HEI472
11.4.24
3
6
-
-
27
±
4
20
±
4
17
±
3
<0.96
-
65,33
7,32
-
-
-
-
350
45
350
2024-1028/24
P240059-24
Njord
NJ131
7.4.24
0
1
309
±
32
29
±
4
31
±
7
32
±
5
<1.41
±
-
64,27
7,20
-
-
-
-
332
336
250
2024-1028/27
P240059-27
Njord
NJ131
7.4.24
1
3
168
±
20
33
±
4
29
±
5
29
±
4
1,9
±
0,4
64,27
7,20
-
-
-
-
332
336
250
2024-1028/28
P240059-28
Njord
NJ131
7.4.24
3
6
157
±
16
25
±
3
28
±
5
27
±
4
4,7
±
0,5
64,27
7,20
-
-
-
-
332
336
250
2024-1028/29
P240059-29
Njord
NJ141
8.4.24
0
1
381
±
36
26
±
3
26
±
5
32
±
5
2,4
±
0,5
64,27
7,20
-
-
-
-
333
337
491
2024-1028/30
P240059-30
Njord
NJ141
8.4.24
1
3
249
±
23
28
±
3
28
±
5
31
±
4
4,0
±
0,5
64,27
7,20
-
-
-
-
333
337
491
2024-1028/31
P240059-31
Njord
NJ141
8.4.24
3
6
124
±
15
22
±
3
29
±
5
27
±
4
4,3
±
0,8
64,27
7,20
-
-
-
-
333
337
491
2024-1028/32
P240059-32
Njord
NJ281
7.4.24
0
1
312
±
31
23
±
3
25
±
5
29
±
4
1,6
±
0,6
64,27
7,20
-
-
-
-
325
177
314
2024-1028/33
P240059-33
Njord
NJ281
7.4.24
1
3
217
±
25
22
±
3
31
±
6
28
±
4
2,2
±
0,8
64,27
7,20
-
-
-
-
325
177
314
2024-1028/34
P240059-34
Njord
NJ281
7.4.24
3
6
116
±
15
22
±
3
29
±
6
26
±
4
2,6
±
0,7
64,27
7,20
-
-
-
-
325
177
314
2024-1028/35
P240059-35
Njord
NJ131
7.4.24
0
1
355
±
35
29
±
4
29
±
5
31
±
5
1,4
±
0,5
64,27
7,20
2,43
44,5
27,3
59,12
332
336
250
2024-1171/1
P240059-25+26
Njord
NJ131
7.4.24
1
2
277
±
28
31
±
4
32
±
6
30
±
4
1,5
±
0,5
64,27
7,20
2,43
55,5
33,6
58,73
332
336
250
2024-1171/2
P240059-25+26
Njord
NJ131
7.4.24
2
3
161
±
20
36
±
4
32
±
6
30
±
4
2,1
±
0,5
64,27
7,20
2,43
56,1
34,8
60,31
332
336
250
2024-1171/3
P240059-25+26
Njord
NJ131
7.4.24
3
4
146
±
19
34
±
4
34
±
6
30
±
4
3,0
±
0,6
64,27
7,20
2,43
56,9
38,2
65,67
332
336
250
2024-1171/4
P240059-25+26
Njord
NJ131
7.4.24
4
5
149
±
19
28
±
4
32
±
6
29
±
4
5,8
±
1,1
64,27
7,20
2,43
52,8
35,6
65,85
332
336
250
2024-1171/5
P240059-25+26
Njord
NJ131
7.4.24
5
6
122
±
16
23
±
3
31
±
6
25
±
4
5,7
±
0,7
64,27
7,20
2,43
52,5
35,3
65,65
332
336
250
2024-1171/6
P240059-25+26
Njord
NJ131
7.4.24
6
7
102
±
14
21
±
4
31
±
6
28
±
4
6,3
±
1,1
64,27
7,20
2,43
58,1
38,7
65,15
332
336
250
2024-1171/7
P240059-25+26
Njord
NJ131
7.4.24
7
8
74
±
11
22
±
3
30
±
5
28
±
4
4,2
±
0,7
64,27
7,20
2,43
53,1
35,8
65,86
332
336
250
2024-1171/8
P240059-25+26
Njord
NJ131
7.4.24
8
9
80
±
9
21
±
3
32
±
6
26
±
4
4,3
±
0,7
64,27
7,20
2,43
60,5
41,2
66,76
332
336
250
2024-1171/9
P240059-25+26
Njord
NJ131
7.4.24
9
10
63
±
11
21
±
4
31
±
6
26
±
4
3,6
±
0,8
64,27
7,20
2,43
57,8
40,6
68,94
332
336
250
2024-1171/10
P240059-25+26
Njord
NJ133
7.4.24
10
11
44
±
9
24
±
3
34
±
6
29
±
4
2,5
±
0,5
64,27
7,20
2,43
55,0
40,4
72,23
332
336
250
2024-1171/11
P240059-25+26
Njord
NJ133
7.4.24
11
12
35
±
9
22
±
3
33
±
6
28
±
4
2,3
±
0,5
64,27
7,20
2,43
65,7
47,4
71,08
332
336
250
2024-1171/12
P240059-25+26
Draugen
DRPL231
17.4.24
0
1
279
±
28
28
±
4
26
±
5
31
±
4
2
±
1
64,36
7,77
-
-
-
-
250
298
517
2024-1028/36
P240059-36
Draugen
DRPL231
17.4.24
1
3
259
±
26
23
±
3
25
±
5
27
±
4
4
±
1
64,36
7,77
-
-
-
-
250
298
517
2024-1028/37
P240059-37
Draugen
DRPL231
17.4.24
3
6
125
±
14
23
±
3
28
±
5
28
±
4
4
±
1
64,36
7,77
-
-
-
-
250
298
517
2024-1028/38
P240059-38
Draugen
DRPL241
17.4.24
0
1
79
±
9
18
±
2
19
±
3
19
±
3
0,5
±
0,2
64,35
7,78
-
-
-
-
247
297
258
2024-1028/39
P240059-39
Draugen
DRPL241
17.4.24
1
3
83
±
9
17
±
2
18
±
3
20
±
3
0,7
±
0,2
64,35
7,78
-
-
-
-
247
297
258
2024-1028/40
P240059-40
Draugen
DRPL241
17.4.24
3
6
38
±
7
17
±
3
21
±
4
21
±
3
0,9
±
0,4
64,35
7,78
-
-
-
-
247
297
258
2024-1028/41
P240059-41
Draugen
DRPL261
17.4.24
0
1
236
±
24
23
±
4
31
±
6
27
±
4
5
±
1
64,35
7,78
-
-
-
-
256
164
532
2024-1028/42
P240059-42
Draugen
DRPL261
17.4.24
1
3
131
±
13
21
±
3
29
±
5
30
±
4
5
±
1
64,35
7,78
-
-
-
-
256
164
532
2024-1028/43
P240059-43
Draugen
DRPL261
17.4.24
3
6
65
±
12
23
±
4
33
±
6
32
±
5
3
±
1
64,35
7,78
-
-
-
-
256
164
532
2024-1028/44
P240059-44
Draugen
DRPL271
17.4.24
0
1
293
±
28
23
±
3
28
±
5
30
±
4
6
±
1
64,34
7,79
-
-
-
-
263
164
985
2024-1028/45
P240059-45
Draugen
DRPL271
17.4.24
1
3
95
±
13
25
±
3
31
±
6
31
±
5
3
±
1
64,34
7,79
-
-
-
-
263
164
985
2024-1028/46
P240059-46
Draugen
DRPL271
17.4.24
3
6
70
±
11
21
±
3
29
±
6
29
±
4
3
±
1
64,34
7,79
-
-
-
-
263
164
985
2024-1028/47
P240059-47
Regional
R6-054
16.4.24
0
1
350
±
41
22
±
5
<15
±
-
25
±
5
5,0
±
4,0
64,83
7,42
2,43
48,0
27,0
53,9
264
2024-1160/1
P240059-01+02
Regional
R6-054
16.4.24
1
2
317
±
44
23
±
5
30
±
9
28
±
4
3,5
±
2,4
64,83
7,42
2,43
47,4
27,2
55,1
264
2024-1160/2
P240059-01+02
Regional
R6-054
16.4.24
2
3
210
±
29
25
±
3
33
±
6
34
±
4
4,6
±
1,5
64,83
7,42
2,43
52,7
30,6
56,0
264
2024-1160/3
P240059-01+02
Regional
R6-054
16.4.24
3
4
139
±
25
26
±
4
28
±
7
25
±
3
3,8
±
1,9
64,83
7,42
2,43
50,3
30,0
57,6
264
2024-1160/4
P240059-01+02
Regional
R6-054
16.4.24
4
5
147
±
37
22
±
5
24
±
9
23
±
4
7,0
±
2,7
64,83
7,42
2,43
51,9
31,4
58,6
264
2024-1160/5
P240059-01+02
Regional
R6-054
16.4.24
5
6
116
±
17
20
±
3
26
±
5
24
±
2
5,6
±
1,6
64,83
7,42
2,43
51,0
31,3
59,4
264
2024-1160/6
P240059-01+02
Regional
R6-054
16.4.24
6
7
103
±
17
18
±
3
27
±
5
24
±
2
6,9
±
1,3
64,83
7,42
2,43
57,9
35,9
60,3
264
2024-1160/7
P240059-01+02
Regional
R6-054
16.4.24
7
8
102
±
18
19
±
2
22
±
5
25
±
2
4,3
±
1,1
64,83
7,42
2,43
58,3
36,0
60,1
264
2024-1160/8
P240059-01+02
Regional
R6-054
16.4.24
8
9
89
±
19
20
±
3
35
±
8
27
±
3
4,5
±
1,6
64,83
7,42
2,43
54,2
33,4
59,8
264
2024-1160/9
P240059-01+02
Regional
R6-054
16.4.24
9
10
72
±
26
17
±
5
24
±
7
24
±
3
6,6
±
2,4
64,83
7,42
2,43
62,6
39,6
61,8
264
2024-1160/10
P240059-01+02
Regional
R6-053
16.4.24
10
11
60
±
11
23
±
4
38
±
7
30
±
4
2,7
±
0,8
64,83
7,42
2,43
28,5
19,1
63,9
264
2024-1160/11
P240059-01+02
Regional
R6-053
16.4.24
11
12
69
±
13
25
±
5
40
±
8
30
±
5
3,1
±
1,0
64,83
7,42
2,43
19,8
13,7
64,9
264
2024-1160/12
P240059-01+02
Regional
R6-084
22.4.24
0
1
534
±
36
22
±
4
24
±
4
30
±
3
2,3
±
1,1
64,25
6,83
2,43
43,1
24,4
54,0
350
2024-1162/1
P240059-03+04
Regional
R6-084
22.4.24
1
2
423
±
36
23
±
3
26
±
7
28
±
3
2,2
±
1,3
64,25
6,83
2,43
49,3
28,9
56,5
350
2024-1162/2
P240059-03+04
Regional
R6-084
22.4.24
2
3
322
±
30
23
±
3
25
±
6
28
±
3
2,5
±
1,9
64,25
6,83
2,43
50,9
31,0
58,9
350
2024-1162/3
P240059-03+04
Regional
R6-084
22.4.24
3
4
173
±
23
27
±
5
39
±
6
33
±
3
2,8
±
1,2
64,25
6,83
2,43
52,9
32,8
60,2
350
2024-1162/4
P240059-03+04
Regional
R6-084
22.4.24
4
5
135
±
24
25
±
3
29
±
5
29
±
3
2,5
±
1,2
64,25
6,83
2,43
56,4
34,4
59,2
350
2024-1162/5
P240059-03+04
Regional
R6-084
22.4.24
5
6
146
±
33
23
±
4
26
±
8
26
±
4
<3
±
-
64,25
6,83
2,43
57,3
34,6
58,6
350
2024-1162/6
P240059-03+04
Regional
R6-084
22.4.24
6
7
126
±
19
24
±
6
28
±
6
28
±
3
1,7
±
1,3
64,25
6,83
2,43
59,9
36,3
58,9
350
2024-1162/7
P240059-03+04
Regional
R6-084
22.4.24
7
8
121
±
23
22
±
3
28
±
6
27
±
3
<1
±
-
64,25
6,83
2,43
56,9
33,9
57,8
350
2024-1162/8
P240059-03+04
Regional
R6-084
22.4.24
8
9
80
±
10
20
±
2
27
±
4
25
±
2
1,3
±
0,6
64,25
6,83
2,43
53,4
32,2
58,4
350
2024-1162/9
P240059-03+04
Regional
R6-084
22.4.24
9
10
84
±
33
24
±
7
22
±
10
27
±
4
<3
±
-
64,25
6,83
2,43
50,5
31,6
60,7
350
2024-1162/10
P240059-03+04
Regional
R6-094
8.4.24
0
1
577
±
51
25
±
4
23
±
6
31
±
4
2,7
±
1,2
64,75
6,16
2,43
53,3
30,0
54,2
312
2024-1167/1
P240059-05+06
Regional
R6-094
8.4.24
1
2
521
±
46
27
±
5
28
±
8
26
±
3
5,2
±
1,9
64,75
6,16
2,43
53,4
30,8
55,7
312
2024-1167/2
P240059-05+06
Regional
R6-094
8.4.24
2
3
322
±
44
25
±
5
38
±
12
29
±
4
7,0
±
3,0
64,75
6,16
2,43
51,7
31,6
59,2
312
2024-1167/3
P240059-05+06
Regional
R6-094
8.4.24
3
4
185
±
27
25
±
3
28
±
6
30
±
3
4,1
±
1,3
64,75
6,16
2,43
54,6
35,2
62,8
312
2024-1167/4
P240059-05+06
Regional
R6-094
8.4.24
4
5
94
±
16
21
±
4
23
±
5
26
±
2
2,1
±
0,9
64,75
6,16
2,43
58,2
37,9
63,6
312
2024-1167/5
P240059-05+06
Regional
R6-094
8.4.24
5
6
90
±
23
20
±
6
21
±
7
25
±
3
2,1
±
1,5
64,75
6,16
2,43
64,5
42,2
64,1
312
2024-1167/6
P240059-05+06
Regional
R6-094
8.4.24
6
7
93
±
18
22
±
4
25
±
6
24
±
2
2,0
±
1,4
64,75
6,16
2,43
59,4
39,6
65,2
312
2024-1167/7
P240059-05+06
Regional
R6-094
8.4.24
7
8
90
±
32
21
±
4
30
±
8
24
±
4
<3
±
-
64,75
6,16
2,43
54,4
36,1
64,8
312
2024-1167/8
P240059-05+06
Regional
R6-094
8.4.24
8
9
63
±
23
23
±
4
27
±
6
24
±
3
2,1
±
1,4
64,75
6,16
2,43
39,3
26,6
65,6
312
2024-1167/9
P240059-05+06
Regional
R6-094
8.4.24
9
10
<50
±
-
17
±
7
29
±
16
21
±
8
<4
±
-
64,75
6,16
2,43
15,6
11,7
70,4
312
2024-1167/10
P240059-05+06
Regional
R6-174
10.4.24
0
1
507
±
48
21
±
6
24
±
9
30
±
4
<2
±
-
65,00
7,20
2,43
35,1
16,7
43,7
295
2024-1168/1
P240059-07+08
Regional
R6-174
10.4.24
1
2
440
±
52
23
±
4
31
±
9
24
±
4
<2
±
-
65,00
7,20
2,43
39,5
20,5
48,7
295
2024-1168/2
P240059-07+08
Regional
R6-174
10.4.24
2
3
354
±
53
23
±
7
<23
±
-
26
±
6
<5
±
-
65,00
7,20
2,43
40,8
21,8
50,5
295
2024-1168/3
P240059-07+08
Regional
R6-174
10.4.24
3
4
228
±
19
20
±
3
24
±
4
24
±
2
2,9
±
0,8
65,00
7,20
2,43
45,8
25,7
53,7
295
2024-1168/4
P240059-07+08
Regional
R6-174
10.4.24
4
5
170
±
26
24
±
5
33
±
8
28
±
3
3,1
±
1,6
65,00
7,20
2,43
51,4
29,8
55,9
295
2024-1168/5
P240059-07+08
Regional
R6-174
10.4.24
5
6
128
±
27
29
±
4
42
±
7
38
±
4
3,6
±
1,9
65,00
7,20
2,43
47,3
27,7
56,3
295
2024-1168/6
P240059-07+08
Regional
R6-174
10.4.24
6
7
107
±
22
21
±
4
27
±
6
30
±
3
2,2
±
1,7
65,00
7,20
2,43
51,5
30,1
56,4
295
2024-1168/7
P240059-07+08
Regional
R6-174
10.4.24
7
8
90
±
12
23
±
2
28
±
4
27
±
2
2,6
±
1,0
65,00
7,20
2,43
50,4
30,5
58,5
295
2024-1168/8
P240059-07+08
Regional
R6-174
10.4.24
8
9
107
±
19
20
±
3
30
±
5
25
±
2
3,5
±
1,5
65,00
7,20
2,43
28,8
18,3
60,2
295
2024-1168/9
P240059-07+08
Regional
R6-174
10.4.24
9
10
135
±
73
<25
±
-
<40
±
-
27
±
10
<6
±
-
65,00
7,20
2,43
9,7
7,3
67,0
295
2024-1168/10
P240059-07+08
Regional
R6-304
15.4.24
0
1
264
±
49
29
±
8
38
±
20
31
±
6
<6
±
-
66,00
8,25
2,43
40,2
18,2
41,8
390
2024-1169/1
P240059-09+10
Regional
R6-304
15.4.24
1
2
237
±
38
30
±
7
31
±
7
32
±
4
5,6
±
2,4
66,00
8,25
2,43
46,0
21,7
44,2
390
2024-1169/2
P240059-09+10
Regional
R6-304
15.4.24
2
3
284
±
60
27
±
9
49
±
13
36
±
5
7,0
±
5,0
66,00
8,25
2,43
47,9
23,0
45,2
390
2024-1169/3
P240059-09+10
Regional
R6-304
15.4.24
3
4
139
±
25
32
±
5
44
±
9
39
±
4
4,8
±
2,2
66,00
8,25
2,43
45,7
22,2
45,7
390
2024-1169/4
P240059-09+10
Regional
R6-304
15.4.24
4
5
96
±
12
22
±
2
34
±
5
32
±
2
3,1
±
1,0
66,00
8,25
2,43
47,1
23,5
47,2
390
2024-1169/5
P240059-09+10
Regional
R6-304
15.4.24
5
6
99
±
22
26
±
4
41
±
10
39
±
4
6,2
±
2,3
66,00
8,25
2,43
45,4
22,7
47,2
390
2024-1169/6
P240059-09+10
Regional
R6-304
15.4.24
6
7
86
±
27
28
±
5
37
±
8
33
±
4
4,3
±
2,3
66,00
8,25
2,43
45,8
23,3
48,1
390
2024-1169/7
P240059-09+10
Regional
R6-304,5
15.4.24
7
8
-
±
-
-
±
-
-
±
-
-
±
-
-
±
-
66,00
8,25
2,43
47,1
24,0
48,3
390
2024-1169/8
P240059-09+10
Regional
R6-304,5
15.4.24
8
9
-
±
-
-
±
-
-
±
-
-
±
-
-
±
-
66,00
8,25
2,43
49,4
25,5
49,1
390
2024-1169/9
P240059-09+10
Regional
R6-304
15.4.24
9
10
<29
27
±
11
43
±
13
34
±
5
6,0
±
4,0
66,00
8,25
2,43
50,5
27,1
51,3
390
2024-1169/10
P240059-09+10
Regional
R6-303
15.4.24
10
11
35
±
7
30
±
4
46
±
8
41
±
6
2,0
±
0,5
66,00
8,25
2,43
53,5
29,8
53,6
390
2024-1169/11
P240059-09+10
Regional
R6-303
15.4.24
11
12
35
±
8
29
±
4
45
±
8
40
±
6
1,5
±
0,6
66,00
8,25
2,43
56,6
32
54,6
390
2024-1169/12
P240059-09+10
Regional
R6-303
15.4.24
12
13
38
±
11
39
±
8
55
±
11
43
±
7
2,3
±
1,2
66,00
8,25
2,43
14,5
9,5
58,6
390
2024-1169/13
P240059-09+10
Regional
R6-314
18.4.24
0
1
297
±
32
22
±
4
24
±
6
24
±
3
4,2
±
1,4
64,41
7,55
2,43
55,5
33,3
58,2
280
2024-1170/1
P240059-11+12
Regional
R6-314
18.4.24
1
2
223
±
29
23
±
4
30
±
7
30
±
3
6,1
±
2,0
64,41
7,55
2,43
49,7
30,6
59,6
280
2024-1170/2
P240059-11+12
Regional
R6-314
18.4.24
2
3
139
±
21
23
±
3
35
±
7
32
±
3
3,0
±
1,2
64,41
7,55
2,43
53
33,6
61,6
280
2024-1170/3
P240059-11+12
Regional
R6-314
18.4.24
3
4
58
±
7
21
±
3
26
±
4
25
±
2
2,2
±
0,7
64,41
7,55
2,43
52,8
34,1
62,9
280
2024-1170/4
P240059-11+12
Regional
R6-314
18.4.24
4
5
59
±
28
18
±
4
29
±
10
23
±
4
<4
±
-
64,41
7,55
2,43
53,1
34,6
63,5
280
2024-1170/5
P240059-11+12
Regional
R6-314
18.4.24
5
6
56
±
13
17
±
2
26
±
6
20
±
2
2,7
±
0,9
64,41
7,55
2,43
52,5
35,3
65,6
280
2024-1170/6
P240059-11+12
Regional
R6-314
18.4.24
6
7
68
±
13
22
±
2
27
±
6
23
±
2
3,6
±
0,9
64,41
7,55
2,43
64,8
43,4
65,7
280
2024-1170/7
P240059-11+12
Regional
R6-314
18.4.24
7
8
77
±
16
20
±
2
26
±
4
24
±
2
2,9
±
1,0
64,41
7,55
2,43
58,8
40,8
68,1
280
2024-1170/8
P240059-11+12
Regional
R6-314
18.4.24
8
9
51
±
14
20
±
2
23
±
5
25
±
2
3,1
±
1,1
64,41
7,55
2,43
61,2
44,2
71,1
280
2024-1170/9
P240059-11+12
Regional
R6-314
18.4.24
9
10
49
±
29
21
±
4
25
±
7
26
±
3
<2
±
-
64,41
7,55
2,43
62,7
46,0
72,3
280
2024-1170/10
P240059-11+12
Regional
R6-313
18.4.24
10
11
23
±
9
24
±
4
32
±
6
29
±
4
1,3
±
0,6
64,41
7,55
2,43
60,8
44,9
72,8
280
2024-1170/11
P240059-11+12
Regional
R6-313
18.4.24
11
12
26
±
8
24
±
4
36
±
7
31
±
5
1,2
±
0,6
64,41
7,55
2,43
26,7
20,4
74,0
280
2024-1170/12
P240059-11+12
1210Pb and 228Th results are not accredited.
2Pb210 measurement not possible because of high self attenuateion in sample, due to presence of elements with high atomic number.
3Not accredited. The sample has been diluted with silica due to small sample size
4Analysed by Institute for Energt Technology (IFE)