Gå til hovedinnhold
Havforskningsinstituttet
HI
English
<- Tilbake
Søk
Søk
Søk
View page in English
Figur
Fra rapporten:
Naturally occurring radioactive substances in fish and sediments
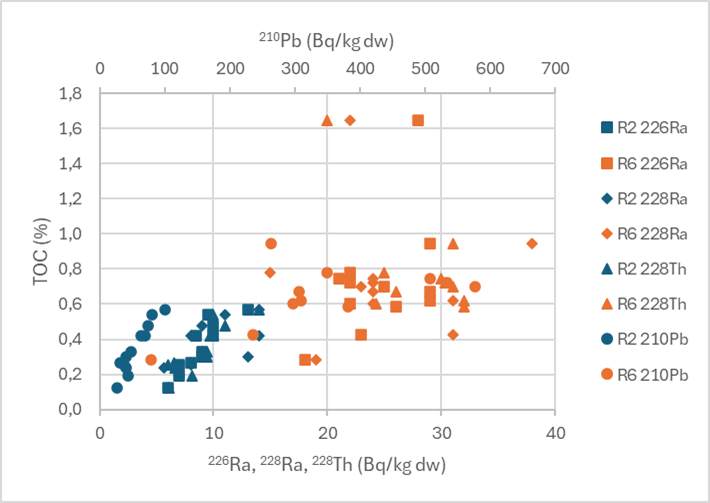
Figure 23 TOC (%) plotted against activity concentrations of 210Pb, 226Ra, 228Ra and 228Th (Bq kg-1 dw) in the 0-1 cm sediment layer. Blue=samples collected in Region II, orange=samples collected in Region VI.