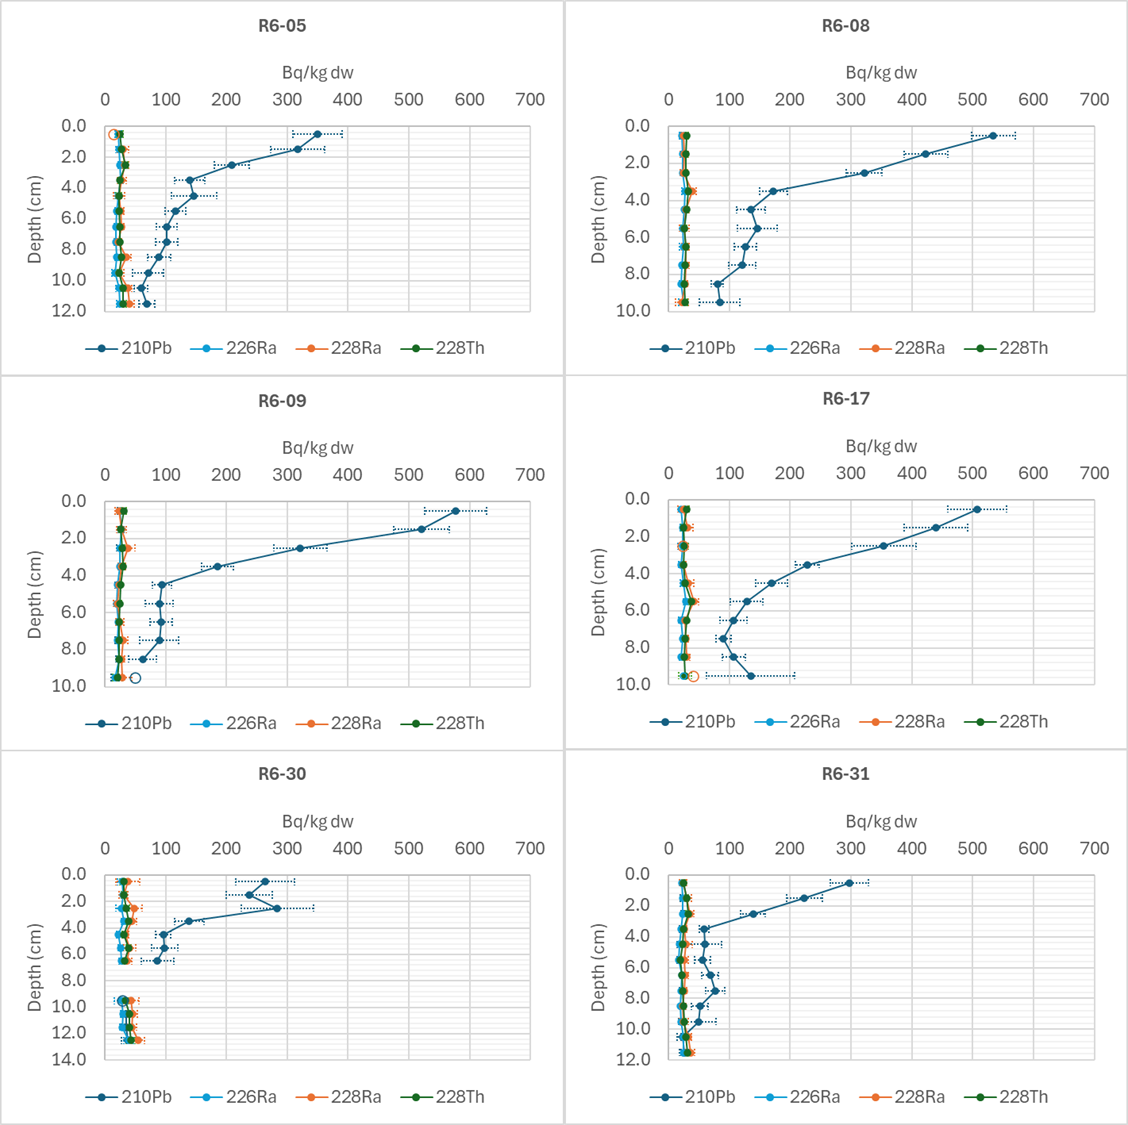
Figure 19 Activity concentrations of 210Pbtot 226Ra, 228Ra and 228Th (Bq kg-1 dw) in sediment cores from regional stations, Region VI. Activity concentrations below detection limits are shown with open symbols. The detection limit is plotted. Analytical uncertainties are given as ±2σ .