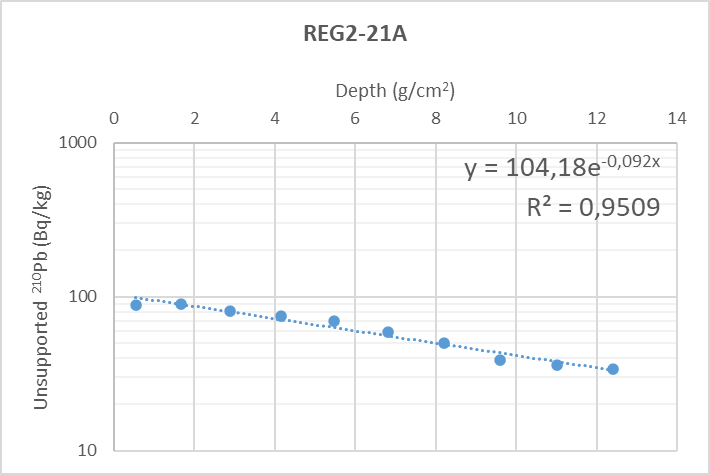
Figure 9 Activity concentrations of 210Pbunsupp in sediment layers from the core collected at station REG2-21A plotted against sediment depth (g cm-2). Average sedimentation rates were determined using exponential curve fits. Note logarithmic scales on the Y-axes.