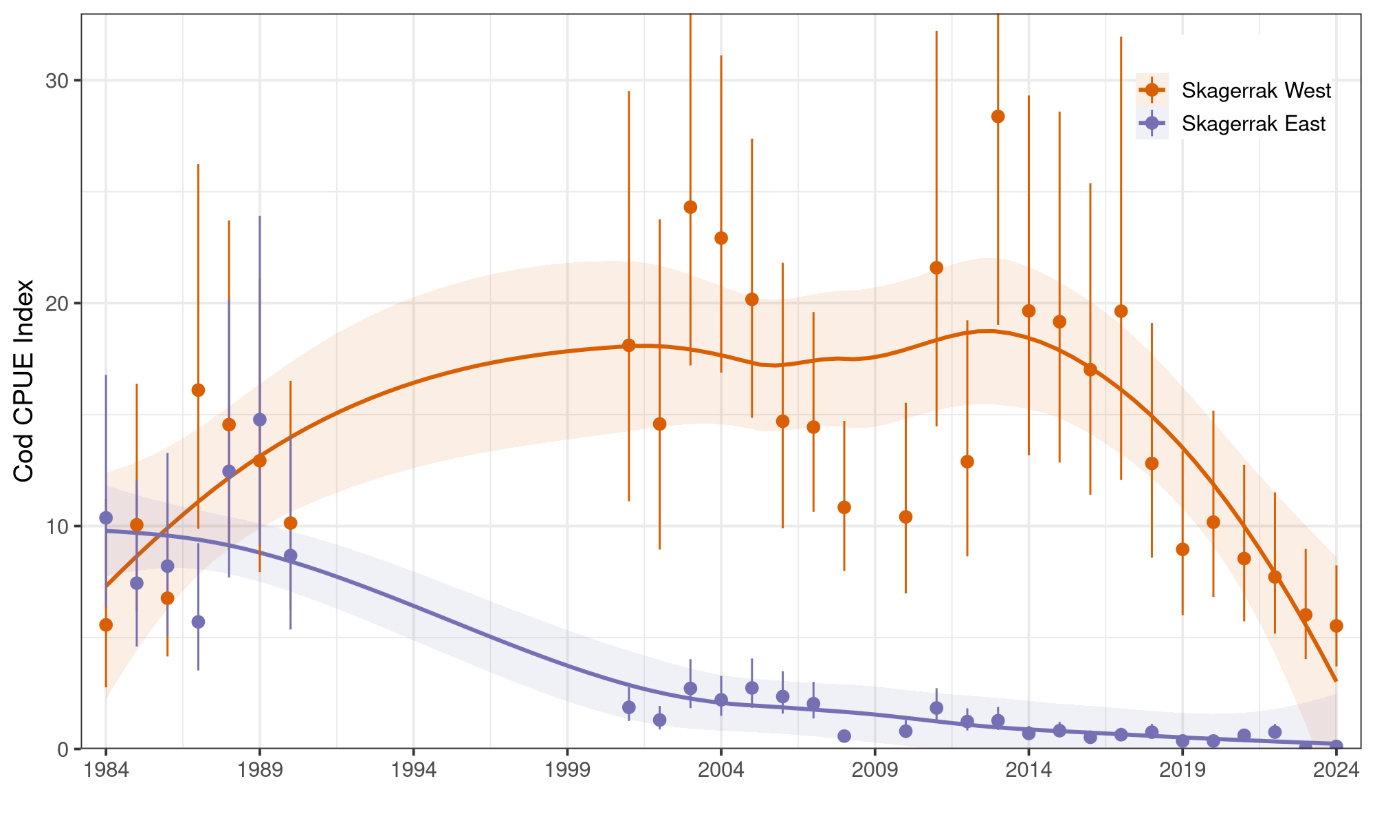
Figure 13. Cod abundance index from the Skagerrak gillnet survey, split into west and east regions. Annual index values 1984-1990, 2001-2008, and 2010-2024 are shown as points and 95% CI are error bars. Trend is shown with a loess smoother, i.e. stats::loess in R, with 95% CI shaded.