Updated status of cod along the Vestlandet and Skagerrak coast: potential for population assessment
Torskebestander langs kysten av Vest- og Sørlandet har hatt en bratt nedgang, og fiskedødelighet er sannsynligvis den viktigste årsaken. To resultater er bekymringsfulle: 1) estimater av fiskedødelighet er sannsynligvis over bærekraftige nivåer, og 2) en høy andel av fangsten som tas med andre redskaper enn garn er sannsynligvis umoden. Kombinasjonen av disse to resultatene er spesielt bekymringsfull. Total dødelighet er høy i alle områder, høyere i Skagerrak enn på Vestlandet, og har økt i Skagerrak. Dette har ført til alvorlig alder- og lengde-kontraksjon, det vil si få store eller gamle fisk. Trenden med at torsken modnes ved mindre størrelse og yngre alder både i Skagerrak og Vestlandet er også bekymringsfull og bør undersøkes videre. Vekstforholdene begrenser ikke torskebestander i Skagerrak eller på Vestlandet, ettersom vekt-ved-alder har økt i alle regioner for de fleste aldre. Rekruttering (alder-1) er usannsynlig å være en viktig faktor i Vestlandet eller vest-Skagerrak, men kan være det i øst-Skagerrak. Dårlig nylig rekruttering i øst-Skagerrak kan skyldes utarming av lokale gytere, mindre tilstrømning av larver fra Nordsjøen, miljøfaktorer eller en kombinasjon.
Disse dataene bør integreres i en populasjonsvurderingsmodell for å estimere bestandsstatus og -trend med usikkerhet. En slik vurdering vil gi et bedre grunnlag for å iverksette, eller ikke iverksette, tiltak for å gjenopprette kysttorsken, samt for å måle effekten av eventuelle tiltak. Denne rapporten arbeider mot målet om å utvikle en eller flere vurderinger av kysttorsk sør for 62°N ved å gjennomgå og oppdatere potensielt nyttige datakilder, samt spesifisere kunnskap og data som mangler. Imidlertid er trendene dokumentert her bekymringsfulle og rettferdiggjør allerede iverksetting av forvaltningstiltak for kysttorsk.
Summary
Cod abundance has steeply declined in Vestlandet and Skagerrak, and fishing mortality is likely the most important cause of population declines. Two results are concerning: 1) estimates of fishing mortality are likely above sustainable levels, and 2) a high proportion of the catch from gears other than gillnets is likely immature. The combination of these two results is especially concerning. Total mortality is high in all areas, higher in Skagerrak than Vestlandet, and has increased in Skagerrak since the 1980s. This has led to severe age- and length-truncation, i.e. few large or old fish. The trend of cod maturing at smaller size and younger age in both Skagerrak and Vestlandet is also concerning and should be investigated further. Growth conditions are not limiting cod in Skagerrak or Vestlandet, as weight-at-age has increased in all regions at most ages. Recruitment (age-1) is unlikely to be an important factor in Vestlandet or western Skagerrak, but may be in eastern Skagerrak. Poor recent recruitment in eastern Skagerrak may be due to depletion of local spawners, less influx of larvae from the North Sea, environmental factors, or a combination.
These data should be integrated in a population assessment model to estimate stock status and trend with uncertainty. Such an assessment would provide a firmer basis for implementing, or not, measures aiming to recover coastal cod populations as well as measuring effects of any measures. This report works toward the goal of developing an assessment(s) of coastal cod south of 62°N by reviewing and updating potentially useful datasets, as well as specifying knowledge and data that are lacking. However, the trends documented here are worrying and already justify implementation of management measures.
1 - Utvidet sammendrag og hovedkonklusjoner
Det har lenge vært enighet om at tilstanden til torsk langs kysten av Vest- og Sørlandet er dårlig og i tilbakegang, selv om det ikke finnes noen formell bestandsvurdering sør for 62°N (Stad). Mange kilder indikerer dårlig status, som synkende fiskeri- og toktfangster. Imidlertid bør disse dataene integreres i en populasjonsvurderingsmodell for å estimere bestandsstatus og -trend med usikkerhet. En slik vurdering vil gi et bedre grunnlag for å iverksette, eller ikke iverksette, tiltak for å gjenopprette kysttorsken, samt for å måle effekten av eventuelle tiltak. Denne rapporten arbeider mot målet om å utvikle en eller flere vurderinger av kysttorsk sør for 62°N ved å gjennomgå og oppdatere potensielt nyttige datakilder, samt spesifisere kunnskap og data som mangler.
Det første steget er å definere populasjonsenheter, det vil si bestandsstruktur. Vi gjennomgår dokumentasjon for populasjonsstruktur og datatilgjengelighet, og foreslår å estimere status for tre områder separat:
Vestlandet (Stad til Lindesnes)
Skagerrak Vest (Lindesnes til Agder-Telemarkgrensen)
Skagerrak Øst (Agder-Telemarkgrensen til grensen mot Sverige)
I tillegg til populasjonsstruktur langs kysten, er det god dokumentasjon på at indre fjordområder er mer dominert av fjordtype torsk sammenlignet med de ytre delene av fjordene og skjærgården, i det minste i Skagerrak. Det er imidlertid vanskelig å anbefale hvor «kysttorsk»-nordsjøtorsk forvaltningsgrensene bør være i retning av innenskjærs-utenskjærs, gitt de tilgjengelige dataene om bevegelse (merking og genetikk), samt romlig dekning og oppløsning av fiskeri- og toktdata. Vi har få data mellom grunnlinjen og 12 nautiske mil (nm) i alle områder, og få data fra indre fjordområder på Vestlandet. Foreløpig anbefaler vi å vurdere torsk innenfor grunnlinjen som «kysttorsk», men ytterligere studier og diskusjoner er nødvendige for torsk mellom grunnlinjen og 12 nm.
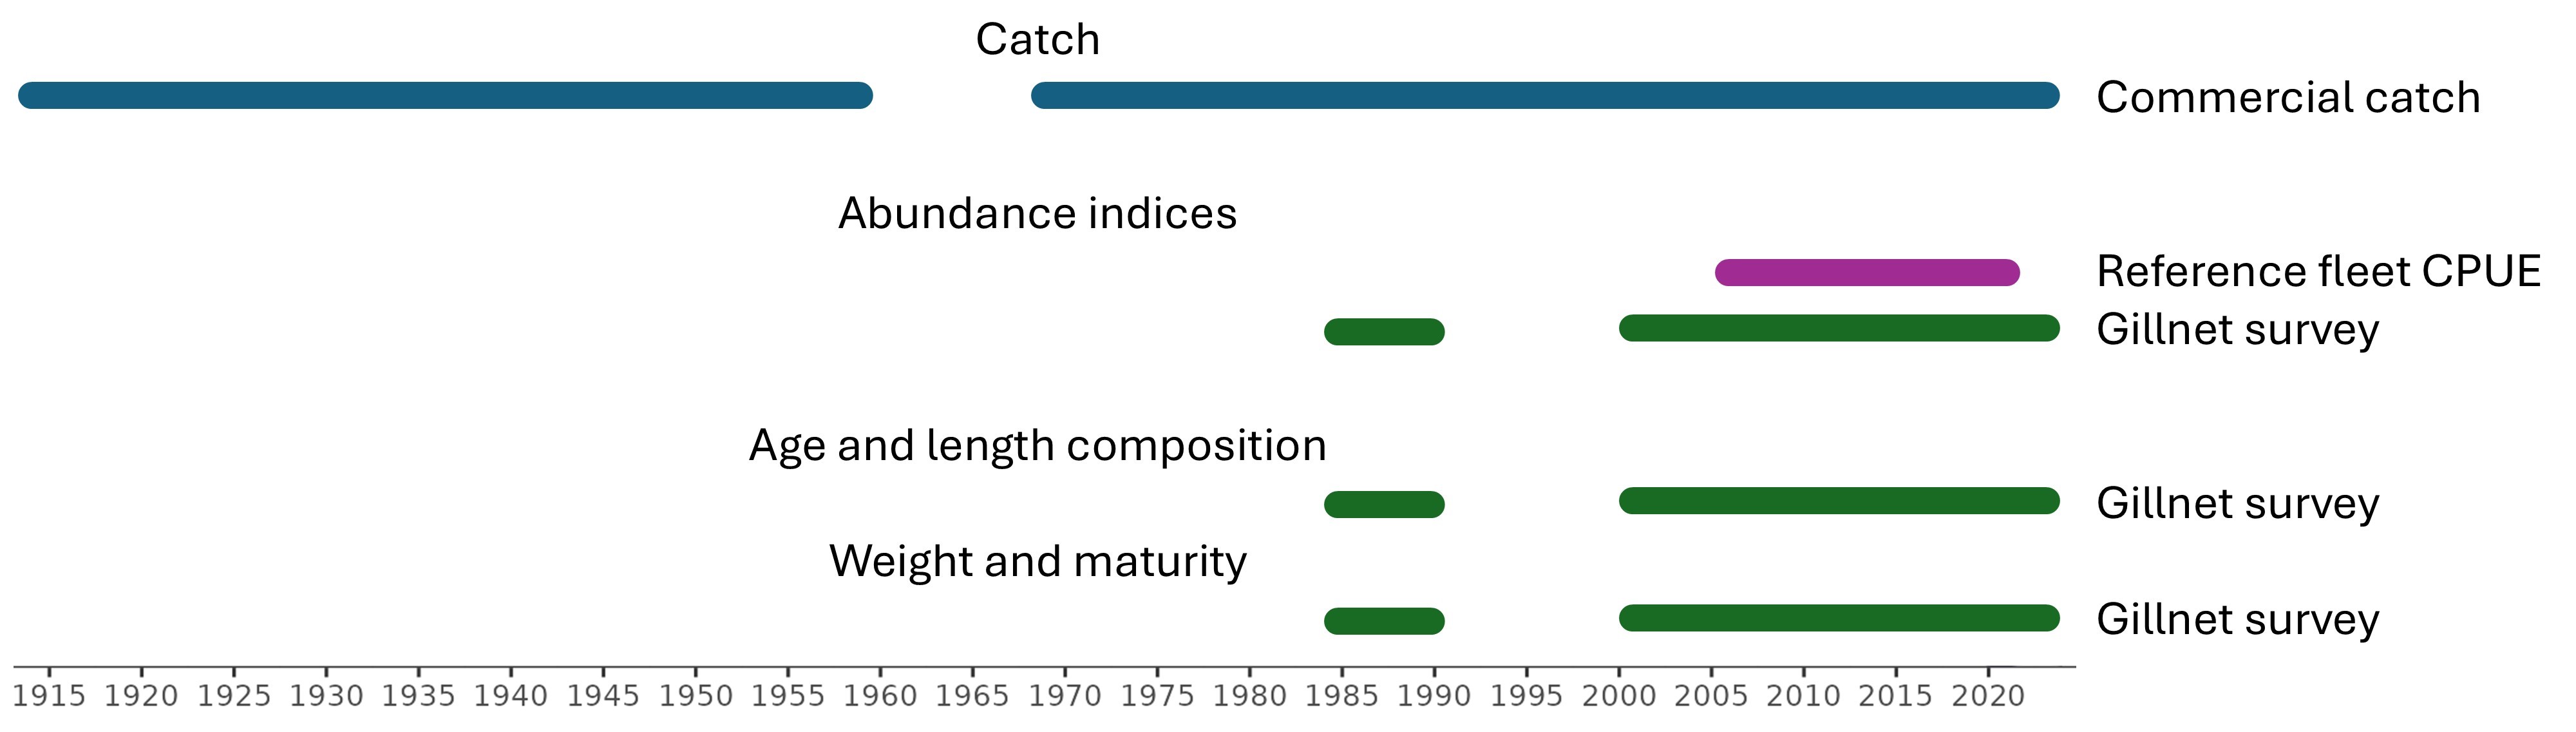
Vi fokuserer deretter på å oppdatere viktige tidsserier som mest sannsynlig vil bli brukt direkte i vurderingen:
Kommersielle landinger, 1914-2024
Kystreferanseflåten garn CPUE, 2006-2024
Skagerrak garntokt, 1984-2024
Vestlandet garntokt, 2015-2023
Andre datasett om kysttorsk kan utforskes, men er mindre informative for bestandsvurdering, for eksempel Skagerrak strandnottokt (lang tidsserie og god romlig dekning, men hovedsakelig begrenset til aldersklasse 0), eggtokt på gyteområder og bifangst i fiskerier etter leppefisk.
1.1 - Fangst:
Kommersielle landinger på 2000-4000 tonn ble opprettholdt fra 1914-2000, men er nå på rundt 250 tonn. Nedgang etter område: Vestlandet 88 %, Skagerrak Vest 91 %, Skagerrak Øst 98 %.
Fangstestimater for fritidsfiske er ikke tilgjengelige, med unntak av noen ufullstendige prosjektestimater. Dødelighet ved fritidsfiske langs Skagerrak-kysten (indre kyst) har tidligere blitt estimert til å være 3 ganger høyere enn dødelighet ved kommersielt fiske.
Reketrålfiske og fritidsfiske fanger en høy andel av små, umodne torsk. Det er behov for arbeid for å estimere den totale mengden, og dermed påvirkningen, av umoden fangst. Garn fanger svært få, om noen, umodne torsk.
1.2 - Abundans:
CPUE-indekser (fangst-per-enhet-innsats) har falt med 75-80 % i Skagerrak og 50 % i Vestlandet fra 2006 til 2024.
Toktindekser for øst- og vest-Skagerrak var like på 1980-tallet og divergerte deretter.
I Skagerrak Øst falt torskemengden dramatisk på 1990-tallet og har siden fortsatt å synke til et ekstremt lavt nivå.
I Skagerrak Vest økte torskebestanden noe på 1990-tallet, forble stabil fra 2001-2017, og falt deretter brått fra 2017-2024.
På Vestlandet var det ingen trend i garnserien fra 2015-2023.
Begge garntokt er i stand til å følge kohortstyrken over tid fra aldersgruppe 1-4. Sterke årsklasser fra 2016 og 2019 ble observert både på Vestlandet og i Skagerrak. På Vestlandet var årsklassene fra 2015 og 2017 svake. I Skagerrak var årsklassen fra 2018 svak.
1.3 - Dødelighet:
Totale dødelighetsestimater for Vestlandet er Z = 0,82-0,90.
Totale dødelighetsestimater fra Skagerrak er betydelig høyere og har økt fra ca. Z = 1,0 på 1980-tallet til ca. Z = 1,5 i de senere årene (årlig overlevelse er 22 %).
Populasjonen i Skagerrak er stadig mer lengde- og alderskontrahert, få individer overlever til stor størrelse eller eldre alder.
1.4 - Livshistorie:
På Vestlandet og i Skagerrak modnes torsken ved mindre størrelse og yngre alder.
I Skagerrak vokser torsken raskere.
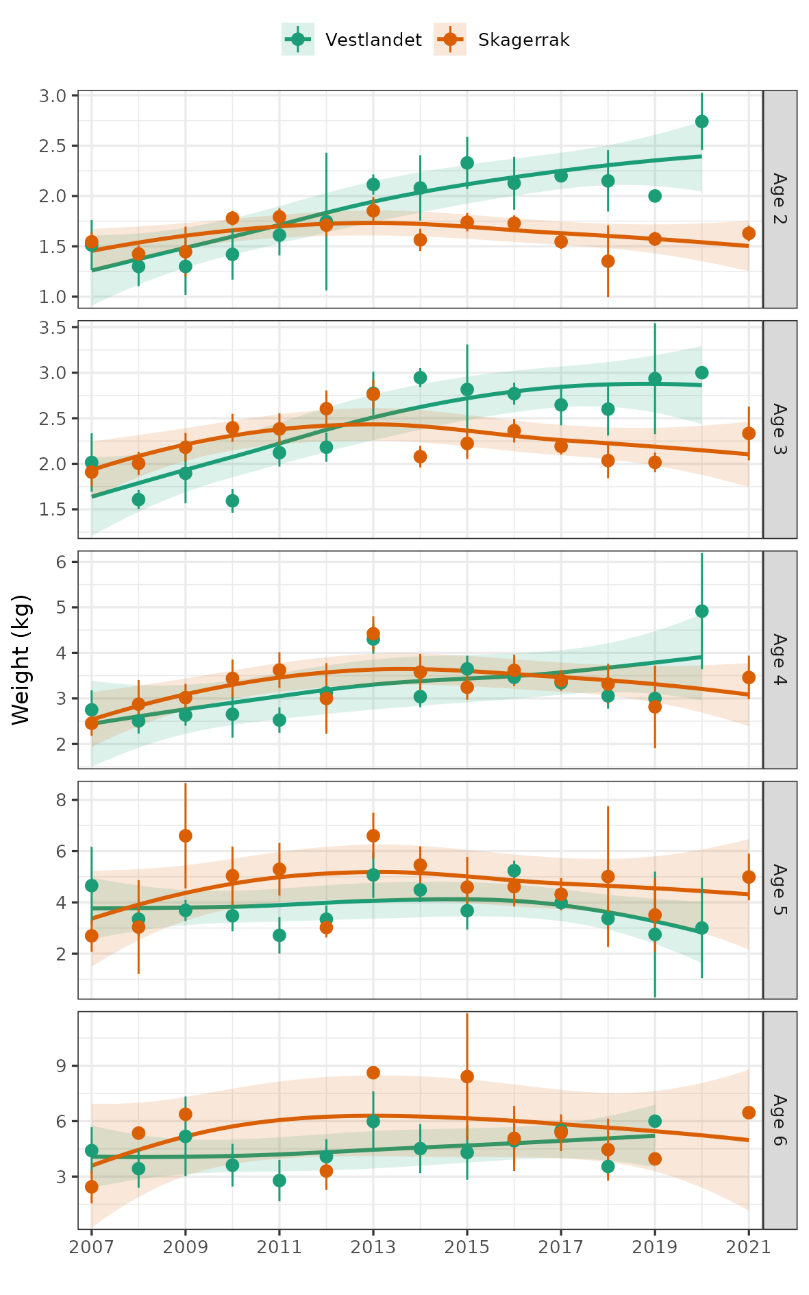
Vekt-ved-lengde har økt på Vestlandet, vært omtrent stabil i Skagerrak Vest, og sunket i Skagerrak Øst. Vekt-ved-alder har økt i alle regioner, og for de fleste aldre.
Vekstforholdene har forbedret seg i alle områder og ser dermed ikke ut til å være begrensende for populasjonsveksten.
1.5 - Rekruttering (alder-1):
Rekruttering har vært variabel i Skagerrak, men viser en klar nedgang siden 2001. Imidlertid er ikke rekrutteringen i Skagerrak Vest lavere enn den var på 1980-tallet.
Tidsserien fra Vestlandet er kort og viser ikke en signifikant trend.
Rekruttering er korrelert mellom Skagerrak Vest og Skagerrak Øst, og svakt korrelert mellom Vestlandet og Skagerrak.
1.6 - Konklusjoner
Torskebestander langs kysten av Vest- og Sørlandet har hatt en bratt nedgang, som sett i kommersiell fangst, CPUE og toktindekser. De viktigste faktorene som påvirker populasjonsdynamikken er rekruttering, vekst, naturlig dødelighet og fiskedødelighet. Av disse er fiskedødelighet sannsynligvis den viktigste årsaken til nedgangen i bestandene. To resultater er bekymringsfulle: 1) estimater av fiskedødelighet er sannsynligvis over bærekraftige nivåer, og 2) en høy andel av fangsten med andre redskaper enn garn er sannsynligvis umoden. Kombinasjonen av disse to resultatene er spesielt bekymringsfull.
Total dødelighet er høy i alle områder, høyere i Skagerrak enn på Vestlandet, og har økt i Skagerrak. Dette har ført til alvorlig alder- og lengde-kontraksjon, det vil si få store eller gamle fisk. Merkegjenfangst analyser i alle områder har vist at fiskedødelighet (F) er høyere enn naturlig dødelighet, og at fritidsfiske F er høyere enn kommersiell F. Fritidsfiskere fanger en høy andel av umoden torsk, en høyere andel av fjordtorsk, og utøvere har lav kunnskap om minstemålet.
Selv om rekruttering (alder-1) har sunket i Skagerrak siden 2001, er det usannsynlig at det er den primære årsaken for nedgangen i Skagerrak Vest, fordi den ikke er lavere enn den var på 1980-tallet. For eksempel var 2019-kohorten sterkere enn nesten alle observerte kohorter fra 1980-tallet. I Skagerrak Øst kan dårlig rekruttering være viktigere, ettersom de fleste kohortene fra 1980-tallet var sterkere enn alle kohorter etter 2001. Dårlig rekruttering i Skagerrak Øst kan skyldes uttømming av lokale gytere, mindre tilstrømning av larver fra Nordsjøen, miljøfaktorer, eller en kombinasjon. Tidsserien for Vestlandet-toktet er kort (9 år) og viser ikke en signifikant trend.
Vekstforholdene begrenser ikke torskebestander i Skagerrak eller på Vestlandet, ettersom vekt-ved-alder har økt i alle regioner for de fleste aldre.
Trenden med at torsken modnes ved mindre størrelse og yngre alder både i Skagerrak og Vestlandet er også bekymringsfull. Ytterligere analyser bør gjøres for å avklare mulige faktorer: fiskeridrevet evolusjon, redusert overlevelse, raskere vekst og endringer i andelen økotyper.
1.7 - Anbefalinger: Forvaltning
Lokale bestander av fjordtorsk er de minste og dermed mest sårbare, og derfor bør reguleringer sikte på best mulig bevaring av fjordtorsk i de indre områdene. Definering av fjordlinjer sør for 62°N eller andre typer soneinndeling bør vurderes.
Det er presserende å redusere fiskedødelighet på torsk langs kysten, spesielt i Skagerrak. Tidligere anbefalte tiltak er fortsatt relevante (Nedreaas et al., 2008; Aglen et al., 2016).
Fritidsfiske har stor innvirkning og bør overvåkes og gis oppmerksomhet i forvaltningen. I tillegg har fritidsfiske større innvirkning på fjordtorsk nærmere kysten. Redskapsrestriksjoner, f.eks. på garn, er verdt å vurdere.
Økt minstemål bør vurderes sør for 62°N til 50-55 cm, basert på 1,1 * L50 og 0,56 * Linf (55 cm for Vestlandet og 45-50 cm for Skagerrak). En øvre størrelsesgrense (minstemål og maksmål) for å redusere dødelighet blant store, verdifulle gytefisk er også verdt å vurdere.
Kunnskap om minstemålet er veldig lav blant fritidsfiskere, spesielt norske innbyggere (9-18%). Tiltak kan vurderes for å øke kunnskap om, og etterlevelse av, minstemålet i fritidsfiske.
Fortsette å finansiere de viktige overvåkingsprogrammene for å evaluere effektene av eventuelle iverksatte tiltak (Skagerrak og Vestlandet garntokt).
1.8 - Anbefalinger: Forskning og overvåking
Fritidsfiske er en viktig kilde til fiskedødelighet langs kysten, men tallene er svært usikre. Arbeid for å estimere fangsten i fritidsfisket bør være en prioritet.
Skagerrak garntokt-tidsserien ("vinterfisket") er de mest verdifulle dataene om bestandstrender for voksen kysttorsk. Arbeid er nødvendig for å forbedre dataintegritet, reproduserbarhet og bruken av disse dataene. Se vedlegg 1-2 for mer detaljer.
Genotyping av arkiverte vevsprøver fra garntoktet i Skagerrak ville være nyttig for å estimere bestandsstørrelse, vekst og modenhet fordelt på økotyper.
Genotyping av arkiverte vevsprøver fra merking- og telemetristudier vil kunne gi nyttig informasjon om distribusjon, bevegelse og dødelighet fordelt på økotyper. Dette vil også bidra til å adressere usikkerhet vedrørende migrasjon bort fra kysten, som hvis ikke-triviell, vil resultere i overvurderte dødelighetsestimater.
Skagerrak garntoktet kan forbedres ved å samle vektdata og vevsprøver for genetikk.
Trendene dokumentert her er bekymringsfulle og rettferdiggjør iverksetting av forvaltningstiltak for kysttorsk. Imidlertid ville en bestandsvurdering for å estimere bestandsstatus og referansepunkter gi et bedre grunnlag for forvaltningsbeslutninger. Avhengig av tilgjengelighet og pålitelighet av totale fangsttidsserier, er passende metoder å vurdere SURBAR, SPiCT og SAM.
2 - Extended summary and main conclusions
There has long been consensus that the status of cod along the coast of Western and Southern Norway is poor and deteriorating, although there is no formal population assessment south of 62°N (Stad). Many sources indicate poor status, such as decreasing fishery and survey catches. However, these data should be integrated in a population assessment model to estimate stock status and trend with uncertainty. Such an assessment would provide a firmer basis for implementing, or not, measures aiming to recover coastal cod populations as well as measuring effects of any measures. This report works toward the goal of developing an assessment(s) of coastal cod south of 62°N by reviewing and updating potentially useful datasets, as well as specifying knowledge and data that are lacking.
The first step is to define population units, i.e. stock structure. We review evidence for population structure and data availability, and propose to estimate status for three areas separately:
Vestlandet (Stad to Lindesnes)
Skagerrak West (Lindesnes to Agder-Telemark border)
Skagerrak East (Agder-Telemark border to Swedish border)
In addition to population structure along the coast, there is good evidence that inner fjord areas are more dominated by fjord-type cod compared to the outer fjords and skerries, at least in Skagerrak. However, recommending where ‘coastal cod’—North Sea cod management boundaries should be in the on-offshore direction is difficult at present given the available data on movement (tagging and genetics) and spatial coverage and resolution of fishery and survey data. We have few data between the baseline and 12 nm in all areas, and few data from inner fjord areas from Vestlandet. We propose considering cod within the baseline (grunnlinje) as ‘coastal cod’. Further studies and discussion are warranted for cod between the baseline and 12 nm.
We then focus on updating key time series that are most likely to be used directly in assessment:
Commercial landings, 1914-2024
Reference fleet gillnet CPUE, 2006-2024
Skagerrak gillnet survey, 1984-2024
Vestlandet gillnet survey, 2015-2023
Other datasets on coastal cod could be explored but are less informative for population assessment, e.g. the Skagerrak beach seine (long time-series and good spatial coverage but mostly limited to age-0), egg surveys on spawning grounds, and bycatch in wrasse fisheries (Aglen et al., 2016).
2.1 - Catch:
Commercial catches of 2000-4000t were sustained from 1914-2000 but have since declined to 250t. Declines by area: Vestlandet 88%, Skagerrak West 91%, Skagerrak East 98%.
Recreational catch estimates are unavailable. Recreational fishing mortality along the Skagerrak coast has previously been estimated as 3x commercial fishing mortality.
Shrimp trawl and recreational fisheries catch a high proportion of small, immature cod. Work is needed to estimate the total quantity , and therefore impact, of immature catch. Gillnets catch very few, if any, immature cod.
2.2 - Abundance:
CPUE indices declined 75-80% in Skagerrak and 50% in Vestlandet from 2006 to 2024.
Survey indices for east and west Skagerrak were similar in the 1980s and then diverged.
In Skagerrak East, cod abundance dramatically declined in the 1990s and has since continued to decline to an extremely low level.
In Skagerrak West, cod abundance increased slightly in the 1990s, remained stable from 2001-2017, and then declined sharply from 2017-2024.
In Vestlandet, there was no trend in survey abundance from 2015-2023.
Both gillnet surveys are capable of following cohort strength over time from ages 1-4. Strong 2016- and 2019-year classes were observed in both Vestlandet and Skagerrak. In Vestlandet, the 2015- and 2017-year classes were weak. In Skagerrak, the 2018-year class was weak.
2.3 - Mortality:
Total mortality in Vestlandet is approximately Z = 0.90.
Total mortality estimates from Skagerrak are substantially higher and have increased from ca. Z = 1.0 in the 1980s to ca. Z = 1.5 in recent years (annual survival 22% yr-1 ).
The cod population in Skagerrak is increasingly length- and age-truncated, i.e. few individuals survive to large size or old age.
2.4 - Life history:
In Vestlandet and Skagerrak, cod have been maturing at smaller size and younger age.
In Skagerrak, cod are growing faster.
Weight-at-length has increased in Vestlandet, been roughly stable in Skagerrak West, and declined in Skagerrak East. Weight-at-age has increased in all regions and at most ages.
Growth conditions for individual cod have improved in all areas and therefore do not seem to not be limiting population growth.
2.5 - Recruitment (age-1):
Recruitment has been variable in Skagerrak but shows a clear decline since 2001. However, recruitment in Skagerrak West is not lower than it was in the 1980s.
The Vestlandet survey time series is short and does not show significant trend.
Recruitment is correlated between Skagerrak West and Skagerrak East, and weakly correlated between Vestlandet and Skagerrak.
2.6 - Conclusions
Cod abundance has steeply declined in Vestlandet and Skagerrak, as seen in commercial catch, reference fleet CPUE, and survey indices. The main drivers of population dynamics are recruitment, growth, natural mortality, and fishing mortality. Of these, fishing mortality is likely the most important cause of population declines . Two results are concerning: 1) estimates of fishing mortality are likely above sustainable levels, and 2) a high proportion of the catch from gears other than gillnets is likely immature. The combination of these two results is especially concerning.
Total mortality is high in all areas, higher in Skagerrak than Vestlandet, and has increased in Skagerrak since the 1980s. This has led to severe age- and length-truncation , i.e. few large or old fish. Mark-recapture analyses in nearshore Skagerrak and Vestlandet have shown that fishing mortality ( F ) is higher than natural mortality, and that recreational F is higher than commercial F. Recreational fishers catch a high proportion of immature cod, higher proportion of fjord cod, and have low awareness of the minimum size.
While recruitment (age-1) has declined in Skagerrak since 2001, it is unlikely the primary driver of decline in Skagerrak West because it is not lower than it was in the 1980s. For example, the 2019 cohort was stronger than almost all observed cohorts from the 1980s. In Skagerrak East, poor recruitment may be more important, as most of the 1980s cohorts were stronger than all cohorts after 2001. Poor recent recruitment in Skagerrak East may be due to depletion of local spawners, less influx of larvae from the North Sea, environmental factors, or a combination. The Vestlandet survey time series is short (9 years) and does not show significant trend.
Growth conditions are not limiting cod in Skagerrak or Vestlandet, as weight-at-age has increased in all regions at most ages.
The trend of cod maturing at smaller size and younger age in both Skagerrak and Vestlandet is also concerning. Further analyses should be done to disentangle possible factors: fisheries-induced evolution, decreased survival, faster growth, and changes in ecotype proportions.
2.7 - Recommendations: Management
Local stocks of fjord cod are the smallest and accordingly most vulnerable, and therefore, regulations should aim at the best possible conservation of fjord cod in the inner areas. Defining fjordlines south of 62N or other types of zoning should be considered.
It is urgent to reduce fishing mortality on cod along the coast, especially in Skagerrak. Previously recommended measures are still relevant (Nedreaas et al. , 2008; Aglen et al. , 2016) .
Recreational fishing has high impact and should be monitored and given management attention. In addition, recreational fishing has higher impact on fjord cod closer to shore. Gear restrictions, e.g. on gillnets, are worth considering.
Increase the minimum size south of 62N to 50-55 cm, based on 1.1 * L50 and 0.56 * Linf (55 cm for Vestlandet and 45-50 cm for Skagerrak). A slot size limit to reduce mortality on large, valuable spawners is also worth considering.
Knowledge of the minimum size is poor among recreational fishers, especially Norwegian residents (9-18%). Consider measures to increase knowledge of, and adherence to, the minimum size in recreational fishing.
Continue to fund the key monitoring programs to evaluate effects of any measures implemented (Skagerrak and Vestlandet gillnet surveys).
2.8 - Recommendations: Research and monitoring
Recreational (turist-/fritidsfiske) catches are an important source of fishing mortality along the coast but are highly uncertain. Work to estimate recreational catches is a priority.
The Skagerrak gillnet (vinterfiske) survey time series is the most valuable data on adult coastal cod population trends. Work is needed to improve data integrity, reproducibility, and use of these data. See Appendices 1-2 for more detail.
Genotyping archived tissue samples from the Skagerrak gillnet survey would be useful to separately estimate abundance, growth, and maturity by ecotype.
Genotyping archived tissue samples from tagging and telemetry studies would provide useful information on distribution, movement, and mortality separately by ecotype. This would also help resolve any concerns that migration away from the coast, if non-trivial, would result in upwardly biased mortality estimates.
The Vestlandet gillnet survey could be improved by collecting weight data and tissue samples for genetics.
The trends documented here are concerning and warrant implementing management measures for coastal cod. However, a stock assessment to estimate population status and reference points would provide a firmer basis for management decisions. Depending on the availability and reliability of total catch time-series, appropriate methods to consider are SURBAR, SPiCT and SAM.
3 - Introduction
There has long been consensus that the status of cod along the coast of Western and Southern Norway is poor and deteriorating, although there is no formal population assessment south of 62°N (Stad). Previous summaries of our knowledge and management of coastal cod south of 62°N were conducted by Nedreaas et al. (2008) and Aglen et al. (2016) , and this report builds on their work.
Many sources indicate very poor status, such as decreasing fishery and survey catches. However, the available data should be integrated in a population assessment model to estimate stock status and trend with uncertainty. Such an assessment would provide a firmer basis for implementing, or not, measures aiming to recover coastal cod populations as well as measuring effects of any measures. This report works toward developing an assessment(s) of coastal cod south of 62°N by reviewing and updating potentially useful datasets, as well as specifying knowledge and data that are lacking.
4 - Population structure
The general picture of cod population structure along the western (Vestlandet) and southern (Skagerrak) Norwegian coast has not fundamentally changed since the previous status report (Aglen et al. 2016). The main conclusion for stock assessment and management is that population dynamics are largely affected by local conditions . The amount of larval input from the North Sea (variable, ca. 15-30% long-term in Skagerrak), is relevant but not the primary driver. Although the Skagerrak has been better studied than Vestlandet, we expect that the same dynamics apply.
Terms used to describe within-species diversity are easily confused. We generally avoid ‘coastal cod’ because it has different meaning to different people and in different areas, e.g. the formal ICES ‘Norwegian coastal cod’ stocks north of 62N (ICES, 2024). ‘Ecotype’ is used to describe “genotypic adaptations to particular environments” (Clemens and Schreck, 2021). For stock assessment purposes, though, the relevant rates of population exchange are demographic/ population-level. Low levels of exchange may be demographically relevant but result in no genetic differentiation.
Two ecotypes of cod coexist along the Norwegian Skagerrak coast, ‘fjord’ and ‘North Sea’ (Knutsen et al. , 2018) . The fjord ecotype primarily occurs in the inner fjords but mixes with the North Sea ecotype in the outer fjords, skerries and nearshore (Fig. 1). The North Sea ecotype is named such due to genetic similarity to reference samples of mature, adult cod from the central and northeastern North Sea, far offshore. The North Sea ecotype is present in the outer fjords and nearshore, well within the baseline (Fig. 1). The ecotype proportions fluctuate greatly, and either ecotype can dominate age-0 catches in a given year. Among older cod caught in nearshore fisheries (outer fjords to baseline), the North Sea ecotype is more abundant (Fig. 1).
Figure 1. Locations of fjord and North Sea cod ecotypes. Left: Genetic assignment of age-0 cod is shown with colored points (red = fjord; blue = North Sea). Data from Knutsen et al. (2018) , n = 6140 from 2000-2015. Right: Genetic assignment of adult cod from the recreational and commercial fisheries. Data from Jorde et al. (2018) , n = 607 from 2012.
Another important recent finding is that adult North Sea-ecotype cod are present year-round in Skagerrak fjords, e.g. in spawning condition during spawning season (Barth et al. , 2017, 2019). Thus, North Sea ecotype cod may spawn locally along the Skagerrak coast. This is consistent with local knowledge from both Vestlandet and Skagerrak that large, mature adults move into the coast and fjords during winter-spring spawning season, e.g. “ferdatorsk” and “Gregoriustorsk”. North Sea ecotype adult cod may also migrate away from the coast—this migration rate is difficult to estimate since the North Sea cod population is much larger. Most cod tagged in fjords are very stationary throughout the year, only moving a few kilometers. A few tagged individuals have moved across the Skagerrak to Denmark. Cod tagged in the outer areas move slightly more than those in the fjords.
In addition, drift of eggs and larvae occurs from cod spawning grounds in the northeastern (Viking Bank to Egersund Bank) or eastern (Fisher Banks to Jutland Bank) North Sea into the Skagerrak and along the Norwegian coast up to Vestlandet (Huserbråten et al., 2018; Spies et al., 2018; Synnes et al., 2021). Spies et al, (2018) further showed that larval dispersal from the North Sea is likely to be demographically important for the outer Skagerrak coast (15-30%) but not inner fjords (1.5-2.5%).
To summarize, cod along the coast in Vestlandet and Skagerrak comprise 2-3 components (Fig. 2).
Figure 2. Spatial life cycle patterns for North Sea (NS) and fjord cod ecotypes. (a,b) NS ecotype cod are mainly along the skerries and outer coast, but also in the fjords. They may a) disperse as larvae from North Sea spawning grounds, or b) be spawned locally. NS ecotype cod move along the coast more than fjord cod, but most do not move far. As adults, they may migrate to spawn a) away from the coast or b) towards the coast. (c) Local, stationary fjord cod are predominately in the inner fjords. Fjord cod mix with other types in the skerries and nearshore areas.
4.1 - Skagerrak
Gillnet survey abundance and life history (growth, maturity) trends from eastern and western Skagerrak strongly diverged from the 1980s to 2000s, indicating that local depletion is occurring, and management should be split into areas along the Skagerrak coast. Maturation norm differences, little movement of tagged fish, and retention of eggs within separate fjords further support splitting management into western and eastern Skagerrak stock areas (Espeland et al., 2007; Jorde et al., 2007; Knutsen et al., 2007; Olsen et al., 2008) .
Although genetic differences between west-east Skagerrak have been found (Olsen et al., 2008), this may simply reflect different proportions of the two ecotypes. To date, there is no evidence for west-east genetic differences within either ecotype. Such differences may exist but remain undetected due to being obscured by the larger between-type differences.
4.2 - Vestlandet
There is less information available to evaluate the genetic structure of coastal cod in Vestlandet.
Across several tagging studies, most recaptures are taken less than 10 km from the release site, and fish migrate further when they get older. Cod in the outer areas migrate more than cod in the inner fjord areas. Cod tagged on spawning grounds in winter migrate more than fish tagged in summer. Movements take place mainly along the coast and very few have been recaptured in the North Sea. Along the coast, there is some exchange between different fjords and between Møre (north of 62N) and Vestlandet. The exchange of adult cod between Vestlandet and the areas from Møre and northwards is larger than the exchange with the North Sea.
4.3 - New understanding of population structure since 2016 report
Here we summarize new results on the population structure of cod along the Vestlandet and Skagerrak coast published since Aglen et al. (2016).
ICES (2015) WD1
Supports separation of NSC and cod along the Vestlandet coast but based on only one sample from Vestlandet.
Kuparinen et al. (2016)
Cod from Risør, on the Norwegian Skagerrak coast, caught only 5-10 km apart in inner and outer fjord habitats have large differences in growth.
Cod caught in the inner fjord grow slower and have lower than cod from the outer fjord.
Kleiven et al. (2016) and Fernández-Chacón et al. (2017)
Mark-recapture analysis of 9,360 cod tagged along the Norwegian Skagerrak coast from Lillesand to Risør (similar area to Fig. 1b, roughly Skagerrak West area in Fig. 5).
Of 842 dead recoveries, the vast majority were recaptured nearby. However, 16 cod were caught on the Danish side of the Norwegian Trench, and 1 was recaptured on the Swedish Skagerrak coast.
Recreational rod/line and fixed gear (fyke net and gillnet) accounted for 34% and 7% of total mortality, commercial fishing (trawl and longline) was 15%, and natural causes 44%. Total annual mortality was 67%, i.e. instantaneous Z = 1.11.
Barth et al. (2017)
Adult and age-0 cod from the Norwegian Skagerrak coast clustered genetically neither with North Sea nor western Baltic cod, indicating distinct local Skagerrak coastal/fjord population(s). However, Oslofjord adult cod were mainly assigned a North Sea origin.
Biophysical modeling shows a large fraction of larval supply is from local recruitment.
Kattegat spawning cod contribute to juveniles along the Norwegian Skagerrak coast, in addition to the North Sea and local fjord/coastal cod.
Huserbråten et al. (2018)
Describes Viking and Dogger cod. Viking cod spawn on the northern North Sea plateau, and most eggs are retained in the area between Viking Bank, Fladen Ground, and Utsira High.
Over 1995-2016, most NSC egg production was on the western slope of the Norwegian Trench between Viking Bank and Egersund Bank. Most of these eggs are advected to the Norwegian coast (Vestlandet and north to ca. 63N).
It is possible that Viking cod have two behaviors (spawn over shelf vs. trench slope) or there is another ‘Trench dispersal unit’.
Jorde et al. (2018)
Designed a panel of 27 SNPs to distinguish Skagerrak fjord cod and oceanic/North Sea cod.
Commercial shrimp trawls caught 96% oceanic and 4% fjord type.
Recreational fishers caught a higher percentage of fjord type, 12%.
Knutsen et al. (2018)
Among age-0 cod caught along the Skagerrak coast: inner fjord areas have primarily fjord type cod, and the outer fjord/skerries are a mix of fjord and oceanic/North Sea type.
North Sea type cod have greater length (20%) and weight (80%) than fjord type cod at age-0.
The ecotype proportions fluctuates greatly, and in a given year either ecotype can dominate age-0 catches.
Barth et al. (2019) and Fernández-Chacón et al. (in prep)
Adult cod (30-75 cm) from Tvedestrand, a fjord on the Norwegian Skagerrak coast, can be split into 3 genetically distinct types: oceanic/North Sea, western Baltic, and Skagerrak fjord. Acoustic tagging data show that all 3 types are resident in the fjord over years.
Fjord type cod used deeper habitat than North Sea type.
Fjord type cod had higher survival and residency than North Sea type for all size classes.
The proportion fjord/North Sea ecotype was different by size class: most larger cod were fjord type and most smaller cod were North Sea type.
Johansen et al. (2020)
Some, but very low, genetic divergence between Oslofjord and Vestlandet cod samples.
Kristensen et al. (2021)
Cod tagged in Sandnesfjorden, a fjord on the Norwegian Skagerrak coast, were assigned fjord vs. oceanic/North Sea ecotype: 41 fjord and 31 North Sea.
More North Sea type (42%) left the fjord than the fjord type (7%), although within fjord home range size was not different by type.
Fjord and North Sea type cod had different diets, based on stable isotope data.
Synnes et al. (2021)
Of 1022 age-0 and age-1 cod sampled in the outer Oslofjord, roughly half were assigned North Sea type and half fjord type. Although the overall split was 50-50, the ecotype proportions varied a lot by location, season, and year.
Local spawning was the most probable source of recruits, but non-trivial dispersal was also estimated from Viking, Dogger, and Kattegat spawning areas.
Sodeland et al. (2022)
Coastal/fjord cod dominate inner coast areas, and offshore/North Sea cod the outer coast/skerries and offshore Skagerrak.
Inversion frequencies on chromosomes 2, 7, and 12 differ between coastal and offshore cod.
Effective population size of coastal and offshore cod inferred from genomics shows large declines of both ecotypes starting over 500-1000 years ago. Coastal cod declined before offshore cod, consistent with the development of fisheries first nearshore and then offshore.
Breistein et al. (2022)
Coastal cod have a genetic gradient north of 62N: they are more similar to NEAC in the north and NSC in the south.
There is small-scale spatial genetic structure and limited connectivity between coastal cod from different fjords.
Vestlandet coastal cod from outer fjord locations are genetically more similar to NSC than corresponding inner fjord samples. It is reasonable to assume that NSC affect coastal cod in the outer areas greater than the inner fjord areas.
Markers have been designed to differentiate between coastal cod and NEAC, not coastal cod and NSC. More work is needed on markers that could differentiate coastal cod and NSC.
Kleiven et al. (in prep)
Recreational fishers in the Oslofjord catch a much higher percentage of fjord ecotype (38%) than Jorde et al. (2018) found for the Skagerrak coast (12%).
Preliminary estimate of the annual recreational cod catch was 27 t.
Only 16% of fishers knew the correct minimum size for cod, 40 cm. The average length of landed cod was near the minimum size and 49% of cod was under the minimum size.
More cod were released than kept.
4.4 - Changes to cod management areas in the North Sea
The Northern Shelf (formerly North Sea) cod assessment contains the Vestlandet and Skagerrak coasts (ICES, 2024a). North Sea cod are connected to cod along the Norwegian coast, both in terms of migration and larval supply. However, catches of cod within 12 nm are considered ‘Norwegian coastal cod’ and removed. Prior to the 2015 benchmark assessment, catch of cod along the Vestlandet coast was included as North Sea cod. However, ICES (2015) decided to remove all ‘coastal cod’ catch based on tagging and genetic evidence showing little mixing between Viking Bank cod and western Norway. The current assessment continues this practice.
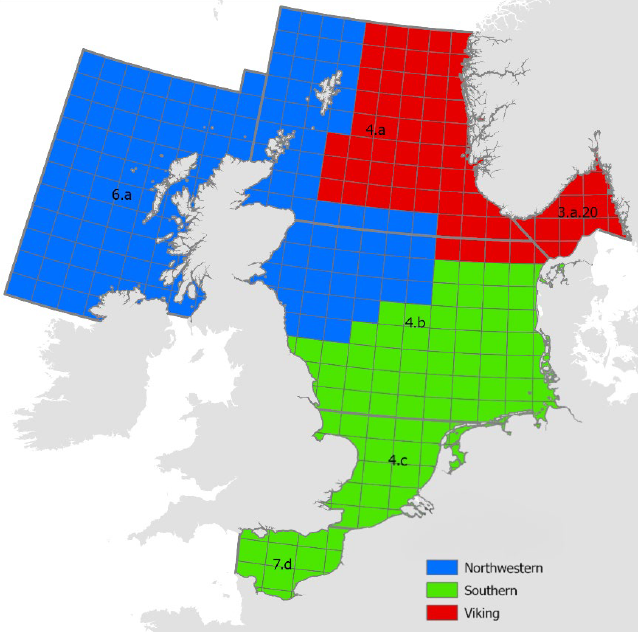
North Sea cod population structure has been recently reviewed (ICES, 2020, 2022) and led to the decision in 2023 to split North Sea cod into three substocks: Northwestern, Viking, and Southern/Dogger (Fig. 3). The most relevant conclusions to the Norwegian coast are:
The Viking and Dogger cod populations are genetically distinct, reproductively isolated, mix/overlap some after spawning, and have different maturity and growth rates.
The Skagerrak is a nursery for Viking and Dogger cod, and most cod in the offshore Skagerrak are Viking cod. Both Dogger and Viking (but especially Viking) cod may be important sources of larvae along the Skagerrak coast, depending on SSB size and location, and current strength and direction following spawning.
North Sea juveniles that grow up on the Skagerrak coast mostly migrate back to the North Sea at maturity (2-3 years old).
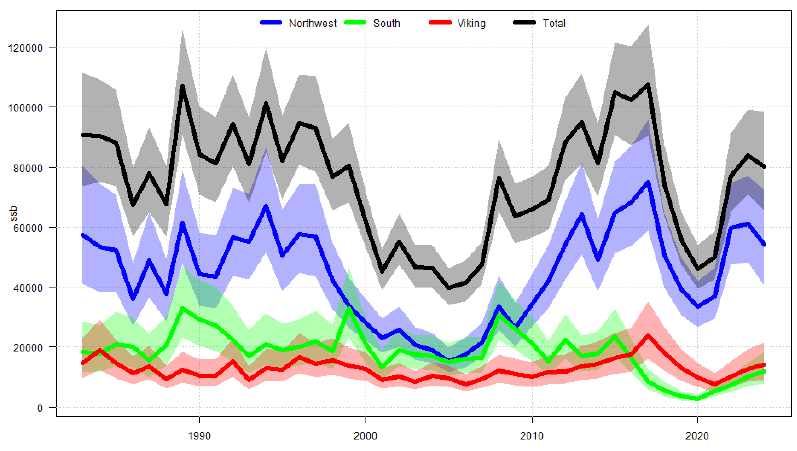
Biomass trends of Viking and Dogger cod are correlated but have recently diverged (Fig. 4). Over the period 2008-2017, Dogger cod SSB strongly decreased while Viking cod increased. Both substocks decreased from 2017-2020 and have since increased.
Despite recent population increase, Dogger cod is still depleted (below Blim ).
North Sea cod appear isolated from Norwegian coastal cod north of 62N.
Figure 3. Recent division of North Sea cod into three substocks: Northwestern, Viking, and Southern/Dogger. From ICES (2024).
Figure 4. “Cod in Subarea 4, divisions 6.a and 7.d, and Subdivision 20. Estimated spawning stock biomass (SSB) from the multistock SAM assessment for each substock and the total stock combined, with pointwise 95% confidence intervals.” From ICES (2024).
4.5 - Recommended assessment areas
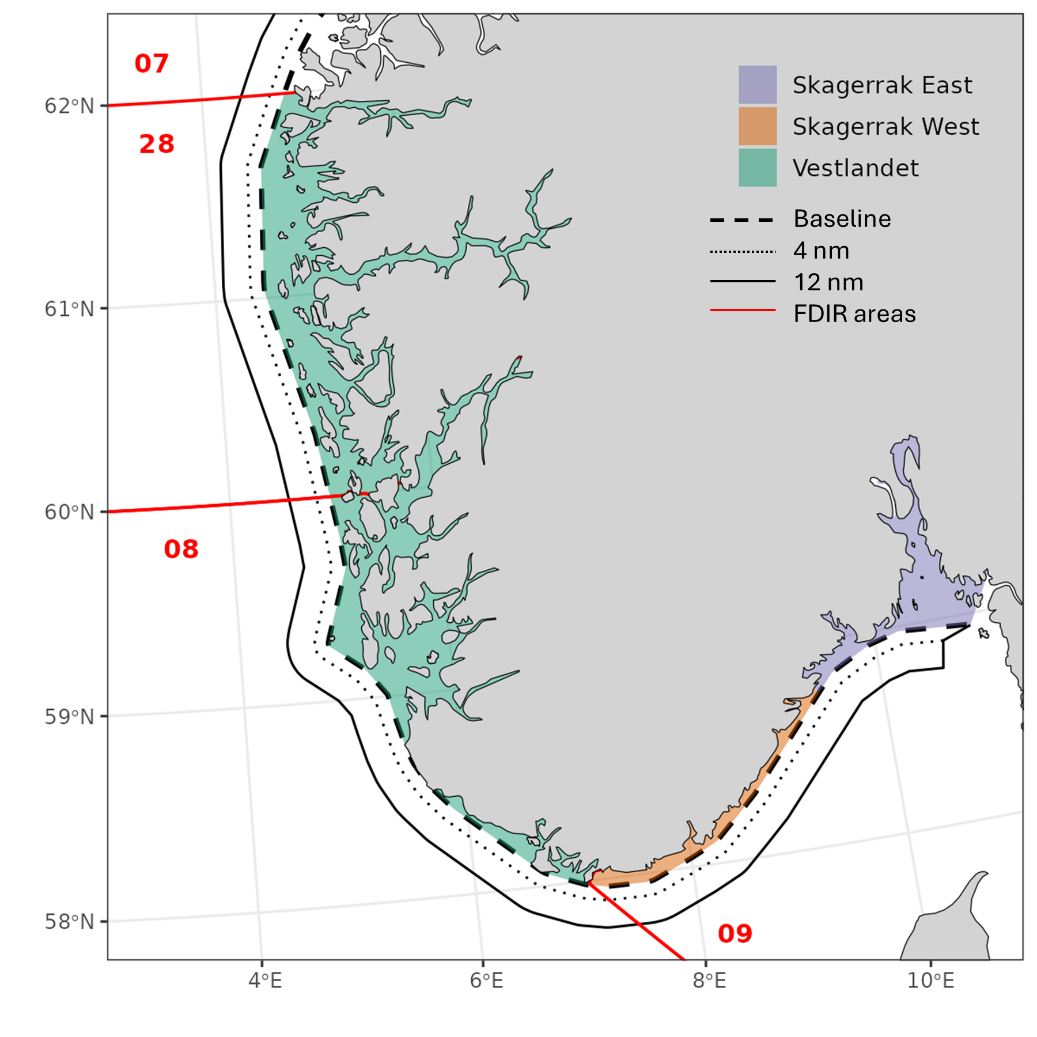
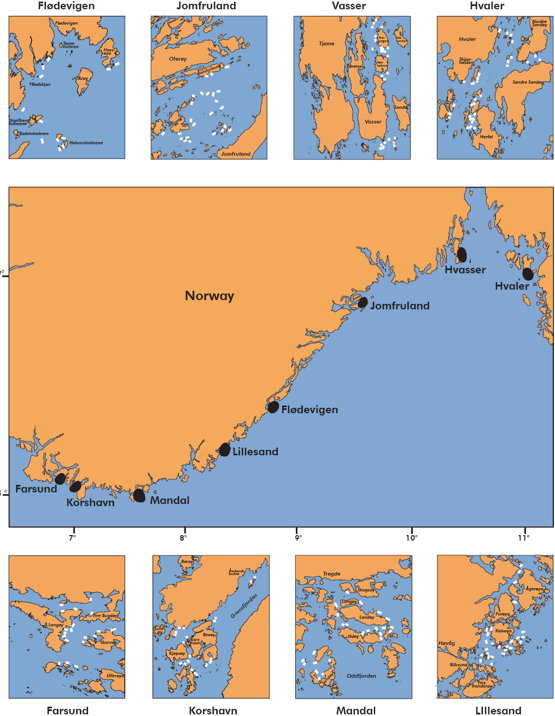
Considering the evidence for population structure and available monitoring data, we believe it is sensible to estimate status for coastal cod in three areas along the coast (Fig. 5):
Vestlandet (Stad to Lindesnes)
Skagerrak West (Lindesnes to Agder-Telemark border)
Skagerrak East (Agder-Telemark border to Swedish border)
Recommending where coastal cod—North Sea cod management boundaries should be in the on-offshore direction is more difficult given our limited data on movement (tagging and genetics), fishery data resolution, and survey coverage. However, there is good evidence that inner fjord areas are more dominated by fjord-type cod compared to the outer fjords and skerries, at least in Skagerrak. For all areas, we propose considering cod within the baseline (grunnlinje) as ‘coastal cod’. Further studies and discussion are warranted for cod between the baseline and 12 nm.
Figure 5. Map of proposed stock assessment areas for coastal cod south of 62N.
5 - Catch
5.1 - Commercial landings
5.1.1 - Historical period, 1914-1969
Landings from 1914-1969 were digitized from Statistics Norway (Statistisk sentralbyrå, SSB, n.d.). The historical landings cannot be split in the on-offshore direction, e.g. within the baseline or 12 nm. However, ‘fjord cod’ and ‘bank cod’ were recorded as separate categories from 1914-1960, then from 1961-1969 these are combined as ‘other cod’. Based on the agreement between historical catch levels of ‘fjord cod’ with more recent (1977-2000) catches within 12 nm (e.g. 2000-4000 tonnes per year), we considered ‘fjord cod’ (and not ‘bank cod’) landings as most representative for coastal cod catch.
Historical landings were split into the three management areas by fylke: Vestlandet = Rogaland, Bergen, Hordaland, Sogn og Fjordane; Skagerrak West = Aust-Agder, Vest-Agder; Skagerrak East = Østfold, Akershus og Oslo, Buskerud, Vestfold, Telemark.
Sales note (sluttseddel) data are available beginning in 1977, and these are recorded as within/outside of 12 nm and by FDIR statistical catch area (28 + 08 = Vestlandet, 09 = Skagerrak). Finer-scale catch area resolution, FDIR lokasjon, becomes useable starting in 1996, when > 90% of sales notes have lokasjon. Logbook data begin in 2005 and it could be possible to combine logbook and sales note data to allocate catches at finer-scale, although this would require significant effort and assumptions.
For this analysis, we constructed time series of coastal cod catches within the three proposed management areas by using the following filters:
within 12 nm approximates ‘coastal cod’
Norwegian vessels
landing fylke (county) approximates catch location to split FDIR area 09 into Skagerrak West and Skagerrak East at the Agder-Telemark border. Vestlandet is already clearly defined by FDIR areas 28 and 08.
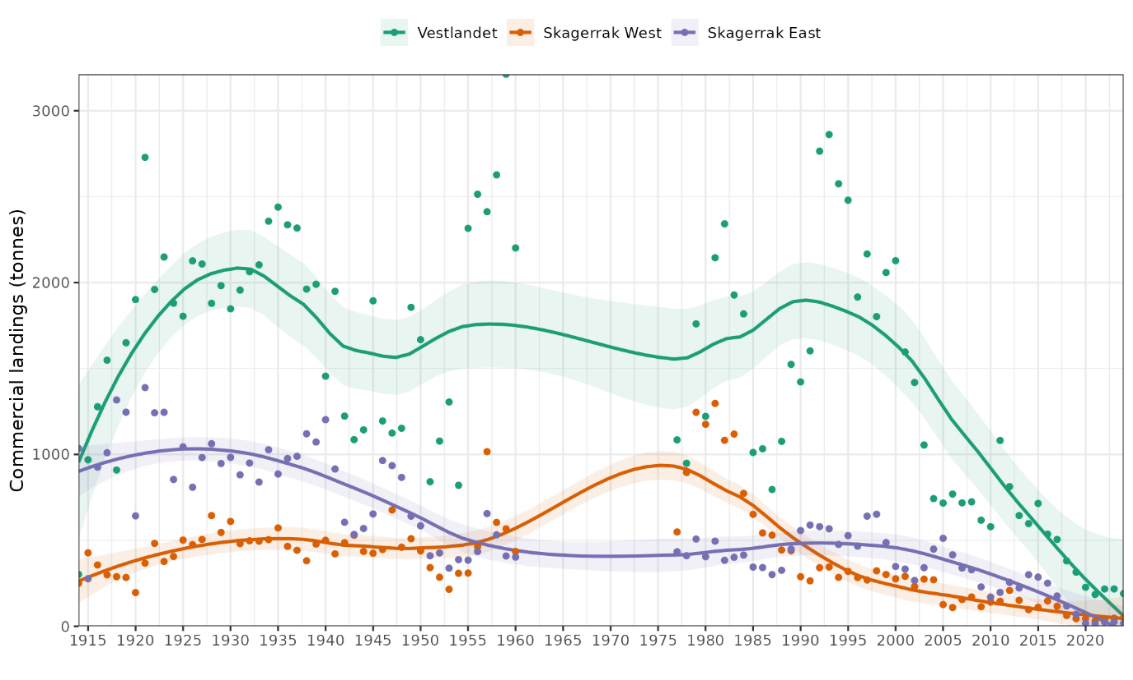
Figure 6. Commercial landings of coastal cod south of 62N, 1914-2024. Annual values are shown as points. Mean trend is shown with a loess smoother with span = 0.5 and 95% CI shaded.
Annual landings in Skagerrak East were stable at ca. 1000 t from 1914-1940, declined to ca. 500 t by 1960, were stable at 500 t from 1960-2005, and then declined (Fig. 6). Landings in Skagerrak West were approx. 500 t for 1914-1960, higher in the 1970s-80s, and then declined. Vestlandet landings varied more substantially between 1000 to 2500 t from 1914-2000 before steeply declining. Recent catches have declined by 88-98% compared to historical levels (2020-2024 average compared to 1914-1960 average): Vestlandet 88%, Skagerrak West 91%, Skagerrak East 98%, and total south of 62N 91%.
Landings by gear type are available in the sluttseddel period, 1977-2024. In Skagerrak, cod were primarily caught using gillnets in the 1970-80s, whereas in recent years gillnets have been almost completely replaced by shrimp trawls (Fig. 7). In Vestlandet, the proportion of cod landings from gillnets has also declined, however, they still account for about 50%.
Figure 7. Commercial landings of coastal cod south of 62N by gear type and statistical area.
5.2 - Non-commercial catch
Time series of effort and catch data are not available for non-commercial fishing. However, several studies in both Vestlandet and Skagerrak have shown that recreational fishing pressure is currently significant relative to commercial fishing. In addition, the concept of ‘recreational’ fishing is somewhat modern, and prior to roughly the 1980s there was likely more unsold catch that we may call ‘household/own-use’ catch. Both Vestlandet and Skagerrak have long traditions of household/own-use fishing for cod that migrates into the coast and fjords for spawning in late winter to spring, “ferdatorsk” or “Gregoriustorsk.”
In western Skagerrak, Kleiven et al.(2016) used mark-recapture data from 2005-2013 to separately estimate the contributions to total mortality from commercial fishing (15.1% SE 0.8), recreational rod and line (33.7% SE 2.4), recreational fixed gear (6.8% SE 0.4), and natural causes (44.4% SE 2.5). Total instantaneous mortality, Z, was 1.11 (95% CI 1.02-1.20). This corresponds to:
Commercial F = 0.17
Recreational F = 0.45
Total F (commercial + recreational) = 0.62
Natural mortality M = 0.49
F/M = 1.27
Note that fish in this study were tagged near shore (within the baseline), and therefore the estimated proportion of commercial vs. recreational fishing mortality applies to this area and not further out where more commercial fishing takes place (between baseline and 12 nm). Commercial fishing gears used were predominantly fyke net and gillnet.
Also in western Skagerrak, Jorde et al. (2018) found that the proportion of fjord cod (vs. offshore/North Sea cod) caught by recreational fishers in 2012 was three times higher than for those caught by commercial shrimp trawlers (11.8% recreational, 4% commercial). Note, however, that these are estimates of the proportion of fjord cod by fisher group, and the total impact is unknown because the total catch by group is unknown.
In Vestlandet, Svåsand and Kristiansen (1990) estimated natural mortality, M, as 0.22 and fishing mortality about 0.6 after recruitment to the fishery as age-2, i.e. F/M = 2.7. They note that the fishery in the study area is predominantly recreational, both resident and tourist. Then, their estimate can be roughly taken as recreational F = 0.6.
Ferter et al. (2023) combined a roving creel survey with a survey of tourist fishing businesses to estimate a total annual recreational cod catch of 73t in Hordaland. Notably, this estimate does not include passive gear, such as fyke nets and gillnets, which are widely used and lightly regulated. Rod and line fishing from land is also not included in the estimate. Knowledge of the minimum landing size was poor: 47% of tourists and 18% of residents. Despite this, 39% of cod caught were released because they were ‘too small’.
Kleiven et al. (in prep) collected similar data as Ferter et al. (2023) for the Oslofjord, except they also surveyed rod and line fishing from land. Their preliminary results show that recreational fishers in the Oslofjord catch a much higher percentage of fjord ecotype, ca. 38%, than Jorde et al. (2018) found for the Skagerrak coast (12%). Their preliminary estimate of the recreational cod catch was 27 t, which is ca. 50% higher than recent commercial landings for the Skagerrak East area (includes Oslofjord). Only 16% of interviewed fishers knew the correct minimum size for cod, 40 cm. The average length of landed cod was near the minimum size and 49% of cod was under the minimum size. More cod were released than kept, often because the cod were “too small.”
Although the magnitude of recreational and household/own-use catches is unknown, potential stock assessments should include time-series of non-commercial catch. These will be highly uncertain and based on assumptions and extrapolations from few datapoints, so several alternative time-series should be constructed for use in sensitivity runs. Possible data sources for catch reconstructions include historical newspapers, interviews, or combining recent recreational catch estimates with assumptions about trends over time.
5.3 - Catch length data
Available data are inadequate to estimate landed or discarded catch-at-age or catch-at-length at the fleet level. Nevertheless, data from the reference fleet and other projects are adequate to give an indication of the length distribution of the important sectors: commercial gillnet, commercial shrimp trawl, and recreational. There are additional data from FDIR controls and reference fleet shrimp trawlers that could be analyzed in the future with additional resources.
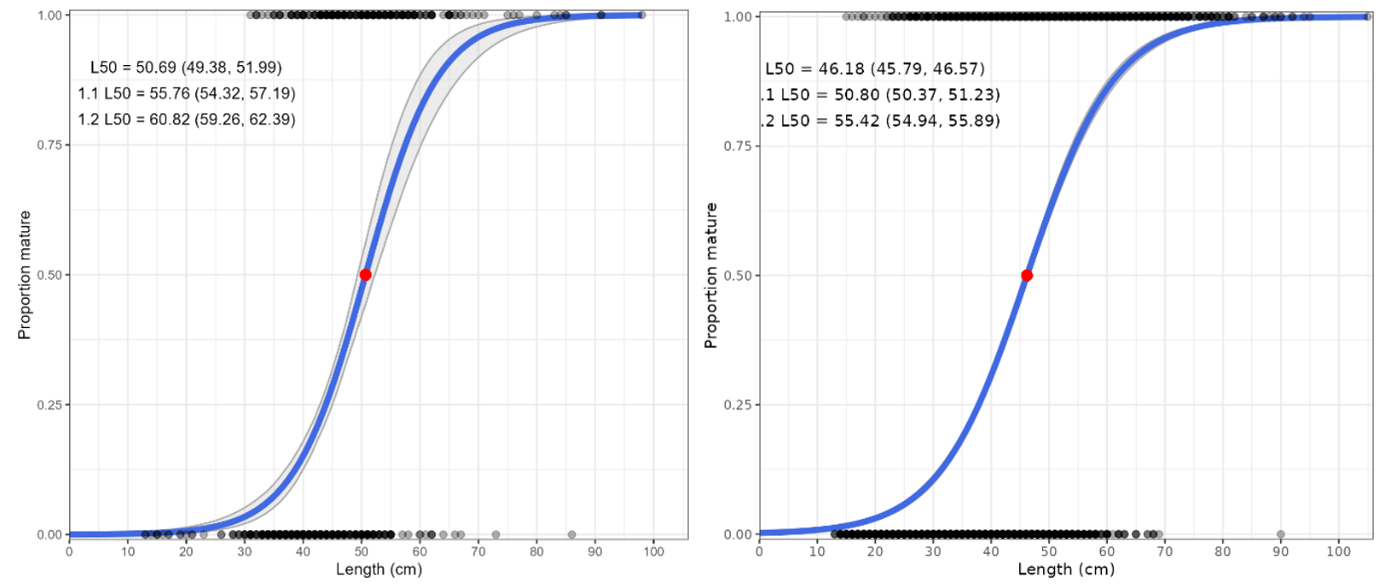
The commercial shrimp trawl and recreational fisheries catch a similar, high proportion of small cod below the minimum size (40 cm) and size at maturity (L50 = 50.7 cm in Vestlandet, 46.2 cm in Skagerrak; Table 1). However, the total quantity of landed and discarded catch of small cod must be estimated to determine the population impact, not just the proportion. The gillnet fishery catches larger cod and very few are below the minimum size or size at maturity.
Area
Sector
% < 40 cm
% < 50 cm
% < L50
Mean length (cm)
Vestlandet
gillnet RF
0.4 (0.2-0.5)
2.8 (2.5-3.2)
3.7 (3.3-4.2)
66.5 (66.3-66.8)
Skagerrak
gillnet RF
0.9 (0.7-1.2)
10.0 (9.3-10.8)
4.9 (4.4-5.4)
59.9 (59.6-60.1)
Skagerrak West
recreational CODFLICT
23.7 (19.4-28.4)
70.2 (65.2-74.8)
56.4 (51.1-61.6)
45.8 (44.9-46.8)
Skagerrak West
shrimp trawl CODFLICT
31.0 (25.9-36.4)
64.0 (58.4-69.3)
55.6 (49.9-61.1)
46.0 (44.6-47.5)
Table 1. Cod mean length and percent below 40 cm, 50 cm, and L50 (length at 50% maturity; 50.7 cm Vestlandet, 46.2 cm Skagerrak) in the commercial gillnet, commercial shrimp trawl, and recreational sectors in Vestlandet and Skagerrak. Aggregated estimates across years. Data sources: RF = reference fleet, CODFLICT = Jorde et al. (2018).
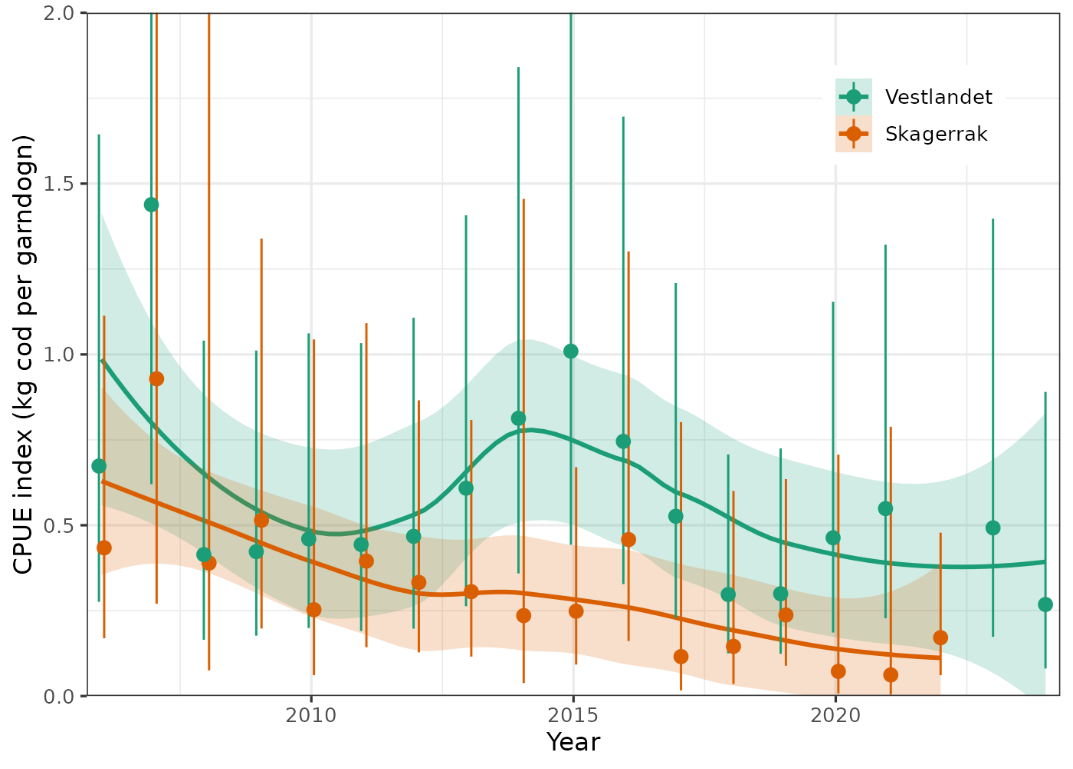
The Norwegian reference fleet is a group of commercial fishing vessels contracted to provide data on fishing operations to IMR (Clegg and Williams, 2020). Reference fleet CPUE data are used to construct abundance indices for several data-limited stocks in Norway, including southern Norwegian coastal cod (cod.27.2coastS; ICES, 2021). There can be issues with using these data for abundance indices: high index uncertainty, changes in catchability or hyperstability, low sample size per year and area, and few consistent vessels across years. If modelled and interpreted carefully, however, fishery CPUE indices can be useful to indicate population trends in the absence of survey data. The reference fleet also provides valuable individual biological data (length, age, weight, maturity) to track trends in age- and length compositions and life history, e.g. growth and maturity.
We calculated an abundance index for coastal cod along the Vestlandet and Skagerrak coasts using reference fleet gillnet CPUE (kg cod per gillnet panel per day). We included reference fleet data from 2006-2024, south of 62N, all gillnet gear types except for anglerfish nets (removed 4129 and 4149), and non-NA soak time. We removed gear codes with less than 10 observations.
We did not filter data by distance offshore, although this could be explored in the future. In Vestlandet, 92% of gillnet sets were within the baseline, so excluding sets beyond the baseline or 4 nm would not meaningfully affect the results. In Skagerrak, most fishing was also within the baseline (58%), but a non-trivial amount (25%) was within the baseline and 4 nm. Thus, deciding that the baseline to 4 nm area is outside of the population area, and therefore excluding reference fleet data within the baseline and 4 nm, could have an impact on the reference fleet CPUE index for Skagerrak.
After filtering, 4,478 gillnet sets remained, 2,863 from Vestlandet and 1,615 from Skagerrak. About 25% (1,003) of the gillnet sets had zero cod catch. As expected, fishing was highest during spawning season in quarter 1, but vessels were also active in Q2 and Q4 (Table 1).
Q1
Q2
Q3
Q4
Number (n)
1,724
1,115
327
1,312
Percent (%)
38%
25%
7%
29%
Table 1. Quarterly distribution of reference fleet gillnet sets south of 62N.
As for coastal cod north of 62N, the reference fleet data are limited by low sample size in some year-area combinations and few consistent vessels across years (Fig. 8). The data are too limited to produce CPUE indices with reasonable levels of uncertainty separately for Skagerrak West and Skagerrak East: only one vessel in the east from 2006-2014, ca. 50 sets total per year from 2012-2022, and no data 2023-2024 (Fig. 8).
Figure 8. Number of reference fleet gillnet sets available for CPUE modelling, by year and area. Colors indicate unique vessels.
We calculated CPUE as the cod catch per gillnet panel per day, i.e. catch weight / (number of gillnet panels * soak time / 24). We fit GLMMs using the ‘sdmTMB’ package (Anderson et al., 2024). We considered three observation distributions appropriate for data with many zeroes: Tweedie, delta-gamma, and delta-lognormal. We included fixed effects for year and quarter, and random effects for vessel and gear. We fit models with and without the vessel and gear effects. The model with lowest AIC and best residuals was the delta-lognormal with vessel and gear random effects, i.e.
To produce the index from the GLMM, we predicted CPUE for each year and quarter and used the most common vessel and gear. We then weighted the predicted CPUE by the fishing effort per quarter, i.e. the percentages in Table 1.
The resulting indices show declines of ca. 75-80% in Skagerrak and 50% in Vestlandet in the period 2006 to 2024 (Fig. 9). Skagerrak CPUE decreased relatively smoothly, whereas Vestlandet CPUE increased in 2013-2015 before continuing to decline. Both areas show little trend in the most recent years, 2017-2024.
Figure 9. Gillnet CPUE indices for cod along the Vestlandet and Skagerrak coasts. Data from the Norwegian reference fleet, 2006-2024. Annual index values are shown as points and 95% CI are error bars. Trend is shown with a loess smoother, i.e. stats::loess in R, with 95% CI shaded.
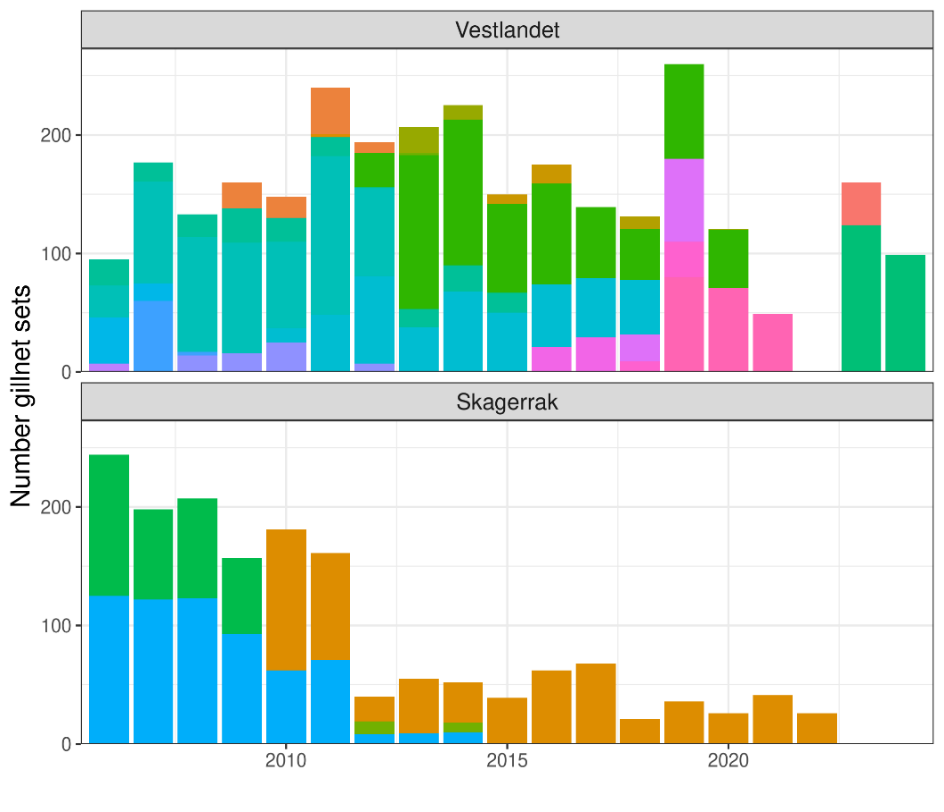
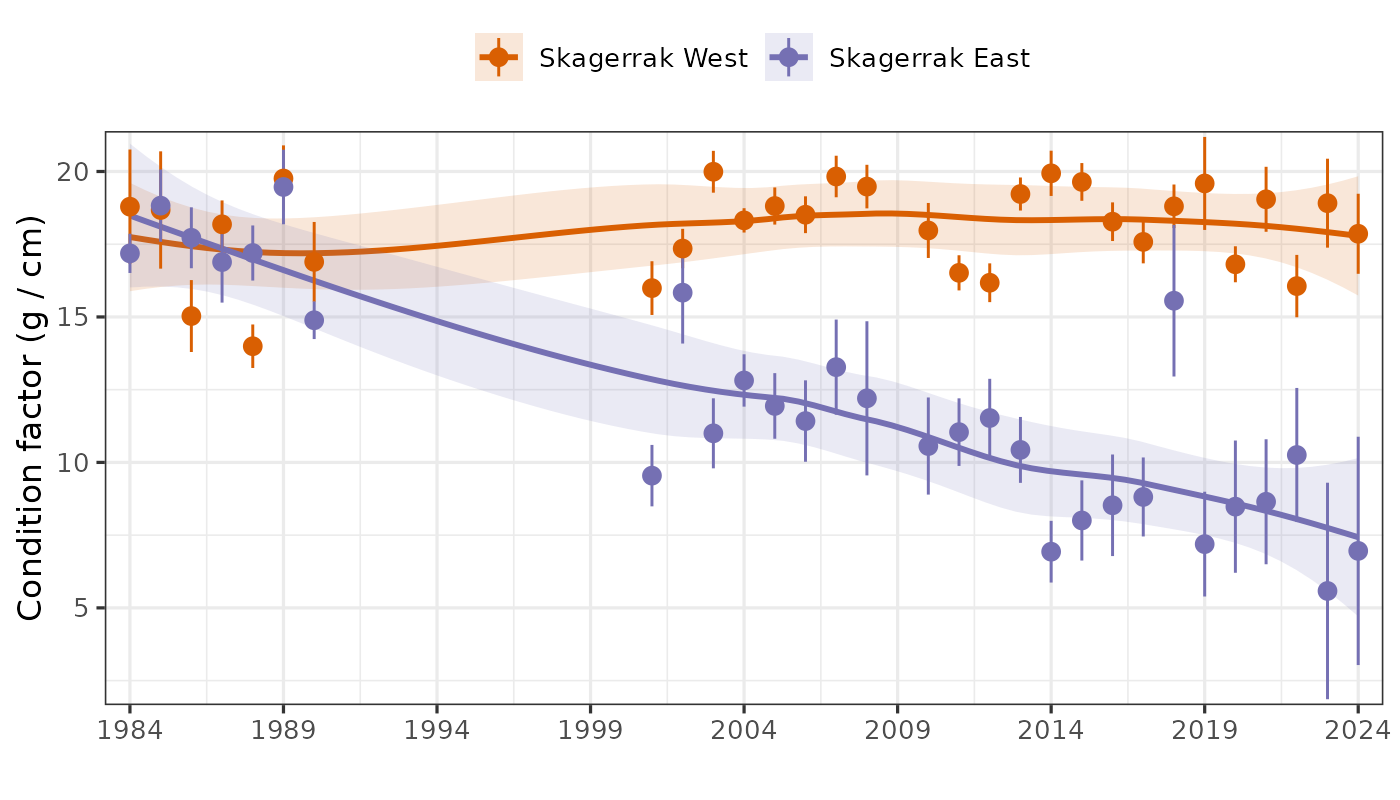
IMR began a standardized gillnet survey targeting cod along the Skagerrak coast in 1984. The survey uses trammel nets with 45 mm mesh, panels 27.5 m long and 2 m high, set in pairs (i.e. each set is two panels tied together). Depths range between 5 and 15 m. Nets are set in the late afternoon and hauled in the following morning, fishing for approximately 16 hours. Station locations are on the outer coast and skerries (Fig. 10). There have been up to 8 areas sampled, with variable coverage. Since 2010, three eastern (Hvaler, Hvasser, Kragerø) and three western (Lillesand, Mandal, Farsund) areas have been covered. The survey is in late Nov to early Dec each year, with gaps 1991-2000 and 2009 due to lack of funding.
When interpreting trends in abundance, abundance-at-age, and life history (growth, size/age of maturation, and mortality from catch curves), potential changes in migration and habitat use that would affect catchability should be considered. For example, if the proportion of older fish migrating away from the coast or to areas deeper than 15 m has increased since the 1980s, this would appear as increased mortality inferred from catch curves. If the proportion of the two ecotypes has changed, that would also impact the interpretation of apparent changes in abundance and life history. Genotyping to assign ecotype is needed to investigate these concerns.
We did extensive quality control and updating of the gillnet survey dataset: fixed many errors in biological data (length, age, weight, maturity stage), added missing data, and revised the number of nets per area per year from original paper datasheets.
Previous analyses ignored fish with missing weight even though CPUE is calculated using weight. We extrapolated weight for fish with missing weight using an estimated length-weight relationship if length was measured, or mean weight-at-age if age was recorded but not length (e.g. for crab-eaten fish it may be possible to collect otoliths but not get a reliable total length measurement). Missing lengths were taken to be mean length-at-age if age was available. Missing ages were taken from the annual age-length key if length was available. For 40 out of 14,339 cod, extrapolating weight was not possible because none of weight, length, or age were measured.
The survey data are not in the IMR database that stores hierarchical data at the station (i.e. net date, time, location, gear type, depth, etc.), catch (i.e. total number and weight by species), and individual (i.e. length, age, weight, etc. of each fish) levels. The number of gillnet panels (effort) per area per year is critical to the calculation of CPUE but was not consistently recorded prior to 2016. We were able to find the number of nets in some years on the original paper datasheets. In other years we inferred nets with zero cod catches from nets that caught other species but not cod, although it is possible there were nets with zero catch of all species. Given the value of this survey to inform status of cod and other species in Skagerrak, entering the entire dataset in the IMR database should be a future priority. Publishing a yearly survey manual and report should also be prioritized (e.g. Fuglebakk and Thorsen, 2024; Søvik et al., 2024) .
Figure 10. Map of Skagerrak gillnet survey areas (black points) and net locations within areas (white points). From (Aglen et al., 2016). Jomfruland = Kragerø.
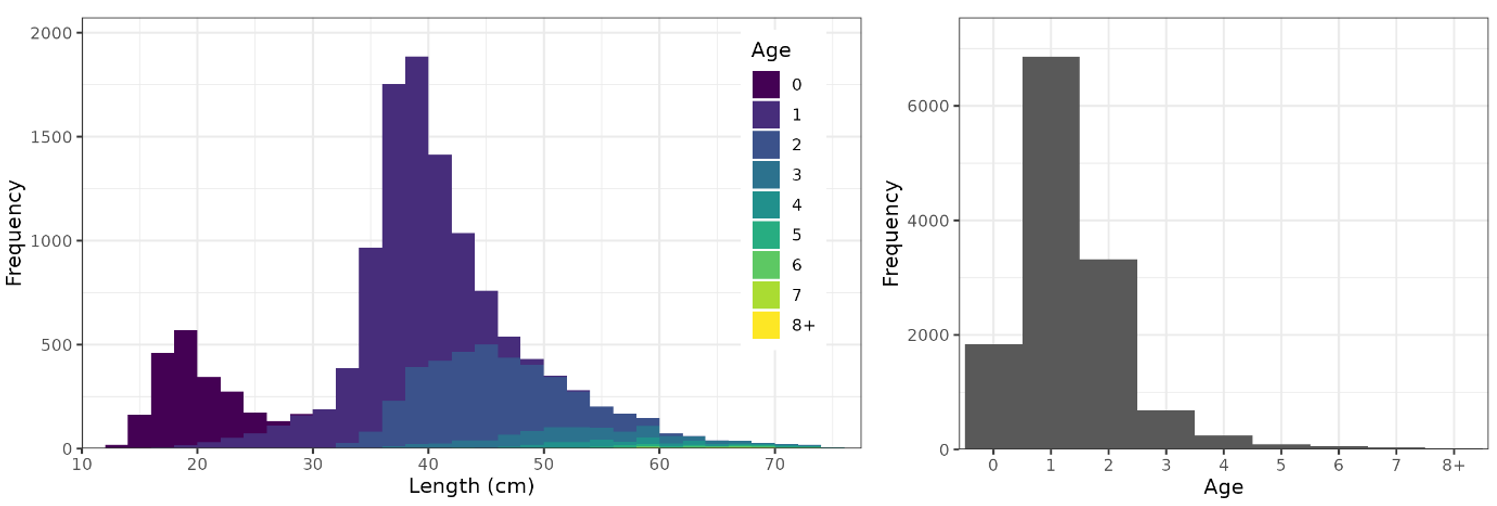
The Skagerrak gillnet survey catches some age-0 cod (length 15-25 cm) but primarily ages 1+ (length 35+ cm, Fig. 11). The survey catches few cod above 70 cm or age-6. The length distribution has a gap between 22-32 cm because most age-0 cod are smaller (15-22 cm) and most age-1 cod are larger (35-45 cm).
Figure 11. Length (left) and age (right) distribution of cod from the Skagerrak gillnet survey.
Figure 12. Skagerrak gillnet survey cod CPUE (kg per gillnet) by area and year. Areas are ordered east to west (Hvaler to Farsund).
We modelled CPUE at the area-year level, as the effort data were not available at the station/net level. We divided the areas into east (Hvaler, Hvasser, Kragerø) and west (Flødevigen, Lillesand, Mandal, Korshamn, Farsund) regions because there were clear differences in CPUE trend between regions (Fig. 12). We fit GLMMs using the ‘sdmTMB’ package (Anderson et al., 2024). We considered a spatial model but a simpler model with random effect of area had lower AIC. We got similar results using lognormal and gamma distributions but chose the lognormal based on residual diagnostics. The final model estimated CPUE by year and region independently plus the area effect, i.e.
cpue ~ 0 + factor(year)*factor(region) + (1|area)
To produce the index from the GLMM we predicted CPUE for each area within region in all years, then summed over all areas. This takes into account that the areas have different CPUE on average, and not all areas were sampled in all years.
Figure 13. Cod abundance index from the Skagerrak gillnet survey, split into west and east regions. Annual index values 1984-1990, 2001-2008, and 2010-2024 are shown as points and 95% CI are error bars. Trend is shown with a loess smoother, i.e. stats::loess in R, with 95% CI shaded.
Indices for east and west Skagerrak were similar in the 1980s and diverged in the 1990s (Fig. 13). Cod abundance in east Skagerrak dramatically declined in the 1990s and has since continued to decline to an extremely low level. In the west, cod abundance increased slightly in the 1990s, remained fairly stable from 2001-2017, and then declined sharply from 2017-2024. Until tissue samples are genotyped and assigned to ecotype, it is unclear whether the decline has been in both ecotypes or only one.
We estimated indices of numbers-at-age for ages 1-4 using the same model formula but Tweedie distribution in place of the lognormal. We did not include age-0 because the gillnets used are not selective for age-0 and the extensive Skagerrak beach seine survey is a much better source of data on age-0 cod abundance (Rogers et al., 2014; Aglen et al., 2016; Barcelo et al., 2016; Knutsen et al., 2022) .
The indices-at-age were highly consistent (correlation coefficients at 1-year lag averaged 0.60, Figs. 14-16), indicating that the survey is capable of following cohort strength over time. For example, the strong 2016- and 2019-year classes and the weak 2018-year class were observed as recent highs and lows at all ages 1-4 in Skagerrak West (Figs. 14 and 16).
Figure 14. Skagerrak West index-at-age consistency for ages 1-4 in the Skagerrak gillnet survey. Left: cohort plot of log(numbers-at-age). Right: upper-left panels show log(numbers-at-age) by cohort, and lower-right panels show correlation coefficients.
Figure 15. Skagerrak East index-at-age consistency for ages 1-4 in the Skagerrak gillnet survey. Left: cohort plot of log(numbers-at-age). Right: upper-left panels show log(numbers-at-age) by cohort, and lower-right panels show correlation coefficients.
Abundance at all ages has declined in both areas (Fig. 16). This means that the decline in overall abundance cannot be explained by a possible change in catchability, e.g. if migration out of the survey area had increased.
Figure 16. Log indices-at-age for ages 1-4 in the Skagerrak gillnet survey. Strong 2016- and 2019- year classes and the weak 2018 year class were observed at all ages 1-4 in Skagerrak West.
6.3 - Vestlandet gillnet survey (garn ruse tokt)
In 2015, IMR began a gillnet and fyke net (trollgarn og åleruser) survey along the Vestlandet coast between Ryfylke and Florø (approximately 59 to 61.5N). The survey takes place in fall in shallow water, with the goal of monitoring juvenile coastal cod and other fish species. The survey covers 6 areas, each with 3 subareas. At each subarea, 4 gillnets and 6 fyke nets are set at fixed positions. Each fyke net set consists of two double fyke nets tied together, around 2-7 m depth. The standard gillnet set is two 27.5 m panels with 45 mm mesh tied together, around 5-15 m depth (some 36 mm nets used initially). After 2020, the survey stopped using fyke nets and instead used additional gillnets due to low catches of cod in the fyke nets. For more details on survey methodology, see Otterå et al. (2024 ).
We combined catches at the same station from the two gillnet mesh sizes because few 36 mm nets were used, and they did not have obviously different selectivity at length or age (Fig. 17). Out of 1566 cod, 1338 were aged. To fill in missing ages, we used an annual age-length key. Weight measurements are not taken on the survey. We fit a length-weight relationship to reference fleet data and used this to estimate weight from length, then summed cod biomass per net (Fig. 18).
Figure 17. Cod length distribution by gear type in the Vestlandet gillnet survey. Fyke nets (ruse) were used in 2015-2020, 36 mm gillnets (garn) in 2015 and 2021, 45 mm gillnets (garn) in 2015-2023.
Figure 18. Cod biomass (kg) per net in the Vestlandet gillnet survey.
We modelled total cod biomass (kg) and numbers-at-age to produce indices in a similar way to the Skagerrak gillnet survey, by fitting GLMMs in ‘sdmTMB’ (Anderson et al. , 2024) , except at the net-level with an effect of gear (garn vs. ruse):
y ~ 0 + factor(year) + factor(gear) + area + (1|subarea)
We again considered a spatial model but a simpler model with fixed effect of main area and random effect of subarea had lower AIC. Since there were more zero catches, we tried Tweedie, delta-lognormal, and delta-gamma distributions. We chose the delta-lognormal based on AIC and residual diagnostics. To produce the index from the GLMM we predicted cod biomass for each area-subarea-year combination, and then summed over all subareas. This takes into account that the areas and subareas have different catches on average, and not all areas or subareas were sampled in all years.
The index was slightly lower in 2016 and higher in 2018, but there is no trend over time (Fig. 19).
Figure 19. Cod biomass index from the Vestlandet gillnet survey. Points are the annual values and the shaded area shows 95% CI.
We estimated indices of numbers-at-age using the same model formula but negative binomial distribution in place of the delta-lognormal. There were enough observations to produce indices-at-age for ages 1-4 and age-5+ plus-group. The indices-at-age were highly consistent (correlation coefficients at 1-year lag above 0.65, Fig. 20), indicating that the survey is capable of following cohort strength over time. Catches of age-1 were also highly correlated with catches at ages 3-4 at 2–3-year lags. For example, the strong 2016 and 2019 year classes can be followed as the grey and green cohorts in Figure 20 and spikes at ages 1-4 in Figure 21.
Figure 20. Index-at-age consistency for ages 1-5+ in the Vestlandet gillnet survey. Left: cohort plot of log(numbers-at-age). Right: upper-left panels show log(numbers-at-age) by cohort, and lower-right panels show correlation coefficients.
Figure 21. Log indices-at-age for ages 1-4 and age-5+ in the Vestlandet gillnet survey. Strong 2016 and 2019 year classes were observed at all ages.
7 - Mortality
Analysis of catch-at-age data, i.e. catch curves, can be used to estimate the instantaneous total mortality rate, Z , under the following assumptions: closed population (no emigration or immigration), constant Z across ages and years, constant catchability/selectivity, and representative sampling (Ogle, 2016). Aggregating data across cohorts makes an additional assumption that recruitment is constant across years, whereas using data by cohort avoids this assumption. If migration of adult cod age 4+ away from the coast is not trivial, then catch curve-based estimates of mortality will be biased (too high).
Following the recommendation of Smith et al. (2012), we used the Chapman–Robson estimator with ‘Peak Plus 1’ criterion, i.e. age of full recruitment set to the age of maximum catch plus 1 year, implemented in Ogle et al. (2023). We excluded catch-at-age for ages where catch was higher than the previous age, which is inconsistent with catch curve assumptions. We estimated Z in two ways: by cohort and aggregated across years. The aggregate Z estimate is a long-term average and more robust to changes in sampling effort by the reference fleet and low sample sizes of older fish in the gillnet surveys. The estimates of Z by cohort are potentially useful to track changes in Z over time.
Figure 22. Left: Catch curve, log(catch-at-age), for cod in coastal reference fleet data from Skagerrak, 2007-2023. Black points show ages used in the aggregate catch curve, and white points show ages excluded (ages 1-3 on ascending limb and age-11 on the descending limb was above age-10). Right: Catch curve estimates of total mortality, Z, by cohort. Points with 95% CI are cohort-specific estimates, and the dashed line is the weighted average (with 95% CI shaded).
Figure 23. Left: Catch curve, log(catch-at-age), for cod in coastal reference fleet data from Vestlandet, 2007-2024. Black points show ages used in the aggregate catch curve, and white points show ages excluded (ages 1-3 on ascending limb and age-12 on the descending limb was above age-11). Right: Catch curve estimates of total mortality, Z, by cohort. Points with 95% CI are cohort-specific estimates, and the dashed line is the weighted average (with 95% CI shaded).
Figure 24. Catch curve estimates of total mortality, Z, from Skagerrak gillnet survey data aggregated into four periods.
Figure 25. Catch curve, log(catch-at-age), for cod from the Vestlandet gillnet survey, aggregated 2015-2023. Black points show ages used and white points show ages excluded (ages 0-2 on the ascending limb).
We present catch curve estimates of total mortality from the reference fleet, Vestlandet survey, and Skagerrak survey in Table 2, together with estimates from the literature. In Vestlandet, total mortality estimates are consistently in the range of 0.82-0.90 across datasets, methods, and time periods. Mortality estimates from Skagerrak are more variable and substantially higher, e.g. 1.25 (1.16-1.35) using the reference fleet data.
In addition, the Skagerrak gillnet survey shows that mortality has increased from around 0.9 to 1.1 in the 1980s, to around 1.3 to 1.7 in the 2010-2024 period (Fig. 24; Table 2). An increase in the instantaneous mortality rate from Z = 1.0 to 1.5 corresponds to a decrease in annual survival from 37% to 22% yr-1. While a decrease in catchability of older fish relative to younger fish, e.g. due to increased migration or use of deeper habitat, would be wrongly interpreted as an increase in Z, this seems an unlikely explanation because abundance at all ages has declined in both west and east areas (Fig. 16).
Area
Dataset
Method
Years
n
Z
95% CI
Vestlandet
Svåsand and Kristiansen (1990)
Mark-recapture
1983-1988
18 491
0.82
Reference fleet
Catch curve*
2007-2024
3 016
0.84
(0.81-0.87)
Reference fleet
Catch curve^
2007-2024
3 016
0.89
(0.78-1.00)
Gillnet survey
Catch curve*
2015-2023
277
0.90
(0.83-0.98)
Skagerrak
Reference fleet
Catch curve*
2007-2023
785
1.25
(1.16-1.35)
Catch curve^
2007-2023
785
1.08
(0.99-1.16)
Skagerrak West
Olsen et al. (2004b) Høvåg
Catch curve*
2000
101
1.11
(0.00-2.56)
Bjelland
Catch curve*
2000
92
1.07
(0.91-1.23)
Bueøya
Catch curve*
2000
107
0.88
(0.51-1.25)
Tvedestrand
Catch curve*
2000
101
0.81
(0.71-0.91)
Risør
Catch curve*
2000
101
0.72
(0.45-0.99)
Julliard et al . (2001) age 0 age 1 age 2 age 3+
Mark-recapture
1986-1989
39 143
3.61 0.55 1.06 1.09
Julliard et al. (2001)
Catch curve
1986-1996
2 049
1.08
(1.04-1.12)
Olsen and Moland (2011)
Telemetry and mark-recapture
2008-2009
60
1.39
Kleiven et al. (2016)
Mark-recapture
2005-2013
9 729
1.11
(1.02-1.20)
Gillnet survey
Catch curve*
1984-1990
652
1.16
(0.77-1.55)
Gillnet survey
Catch curve*
2001-2008
1 071
1.58
(0.86-2.30)
Gillnet survey
Catch curve*
2010-2016
969
1.40
(1.24-1.57)
Gillnet survey
Catch curve*
2017-2024
556
1.32
(1.15-1.49)
Skagerrak East
Olsen et al. (2004b) Grenland
Catch curve*
2000
100
0.45
(0.33-0.57)
Oslofjorden
Catch curve*
2000
109
1.02
(0.80-1.24)
Fredrikstad
Catch curve*
2000
110
0.80
(0.60-1.00)
Gillnet survey
Catch curve*
1984-1990
997
0.93
(0.73-1.13)
Gillnet survey
Catch curve*
2001-2008
341
0.82
(0.60-1.04)
Gillnet survey
Catch curve*
2010-2016
139
1.60
(1.53-1.67)
Gillnet survey
Catch curve*
2017-2024
67
1.75
(1.04-2.45)
Table 2. Estimates of total mortality, Z, of coastal cod. Two catch curve methods were used: aggregate (*) and weighted average of cohort-specific (^). Sample size, n, is the number of fish in the age range used, i.e. excluding the ascending limb of the catch curve.
7.1 - Fishing mortality (F) vs. natural mortality (M)
Without a stock assessment, mark-recapture analyses are the best method of separating total mortality into fishing and natural mortality.
In Vestlandet, Svåsand and Kristiansen (1990) estimated natural mortality in Heimarkspollen, Vestlandet as M = 0.22 and fishing mortality about F = 0.6 after recruitment to the fishery as age-2, i.e. F/M = 2.7. They note that the fishery in the study area is predominantly recreational, both resident and tourist. Then, their estimate can be roughly taken as recreational F = 0.6.
In western Skagerrak, Kleiven et al. (2016) tagged cod in 2012 and separated total mortality, Z = 1.11, into:
Commercial F = 0.17
Recreational F = 0.45
Total F (commercial + recreational) = 0.62
Natural mortality M = 0.49
F/M = 1.27
Also in western Skagerrak (Risør), Julliard et al. (2001) analyzed cod tagged in 1986-1989 and estimated total mortality by age as:
age 0 Z = 3.61
age 1 Z = 0.55
age 2 Z = 1.06
age 3+ Z = 1.09
They found that natural mortality was very high for age-0 cod, and much lower for ages 1+. They estimated F = 0.9 for age-2 cod (F/M = 5.6), largely from recreational fishing in the summer. Commercial fishing in winter was the primary cause of mortality of age 3+ cod.
Extrapolating results from these studies in space, time, or both should be done with caution. All of these studies were conducted near shore (within the baseline), and therefore the mortality estimates apply to this area and not further out where more commercial fishing takes place (between baseline and 12 nm). The estimates are also from fish sampled in different years, and extrapolating meta-analyses across fish stocks have found that sustainable levels of F (FMSY) are generally below M (FMSY/M = 0.87 in Zhou et al., 2012 ; FMSY/M = 0.73 in Zhou et al., 2020) . Although the available mark-recapture-based estimates of F/M for Vestlandet and Skagerrak are limited in year and spatial coverage, they show that F is probably above sustainable levels, and that the recreational fishery has high impact.
In addition to F, the exploitation pattern (selectivity) by length and age is important to determining if a fishery is sustainable. Prince and Hordyk (2018) show how F/M and the minimum size (relative to length-at-maturity, L50) interact, and advocate for setting the minimum size based on L50. Yields are highest when fisheries avoid catch of immature fish. Only when F/M < 1 can yields be optimized if the minimum size is less than L50. For coastal cod in Vestlandet and Skagerrak, F/M > 1 and substantial catch of immature fish occurs.
8 - Life history
When interpreting changes in growth and maturity, one critical aspect to keep in mind is that the Skagerrak gillnet survey data likely represent a mix of fjord and offshore ecotypes, which have different vital rates. For example, the apparent reduction in length- and age-at-50%-maturity in the Skagerrak could be the result of a shift in ecotypes from more offshore cod to more fjord cod, if offshore cod mature at greater length and age.
8.1 - Growth (age-length)
In Vestlandet, cod grow slower and to larger maximum size. In Skagerrak, cod grow faster but to smaller maximum size (Table 3). Froese et al. (2016) show how estimates of Linf, the average maximum size, are useful for setting minimum size limits in data-limited situations and recommend setting minimum size limits at 0.56 * Linf. In Vestlandet, 0.56 * 98.0 cm = 55 cm. In Skagerrak, 0.56 * 81.0 = 45 cm.
To estimate growth parameters for Vestlandet coastal cod, we combined data from the reference fleet and gillnet survey (Fig. 26, Table 3). Combining the datasets is useful because the gillnet survey catches few older fish and the reference fleet does not catch young fish. Two weightings were combined in the fit: 1) each age gets equal weight, i.e. each datapoint gets weight 1/na where na is the number of fish of age a; and 2) weights correcting for size selectivity at age in the catch (Taylor et al., 2005; ICES, 2021) , i.e. larger fish of each age are more likely to be sampled (especially for younger ages in the fishery).
Figure 26. Growth curve for Vestlandet coastal cod, combined data from the reference fleet and gillnet survey. Linf = 98.0 cm, k = 0.199, t0 = -1.05.
Figure 27. Growth curve for Skagerrak coastal cod, gillnet survey data. Linf = 81.0 cm, k = 0.250, t0 = -1.19.
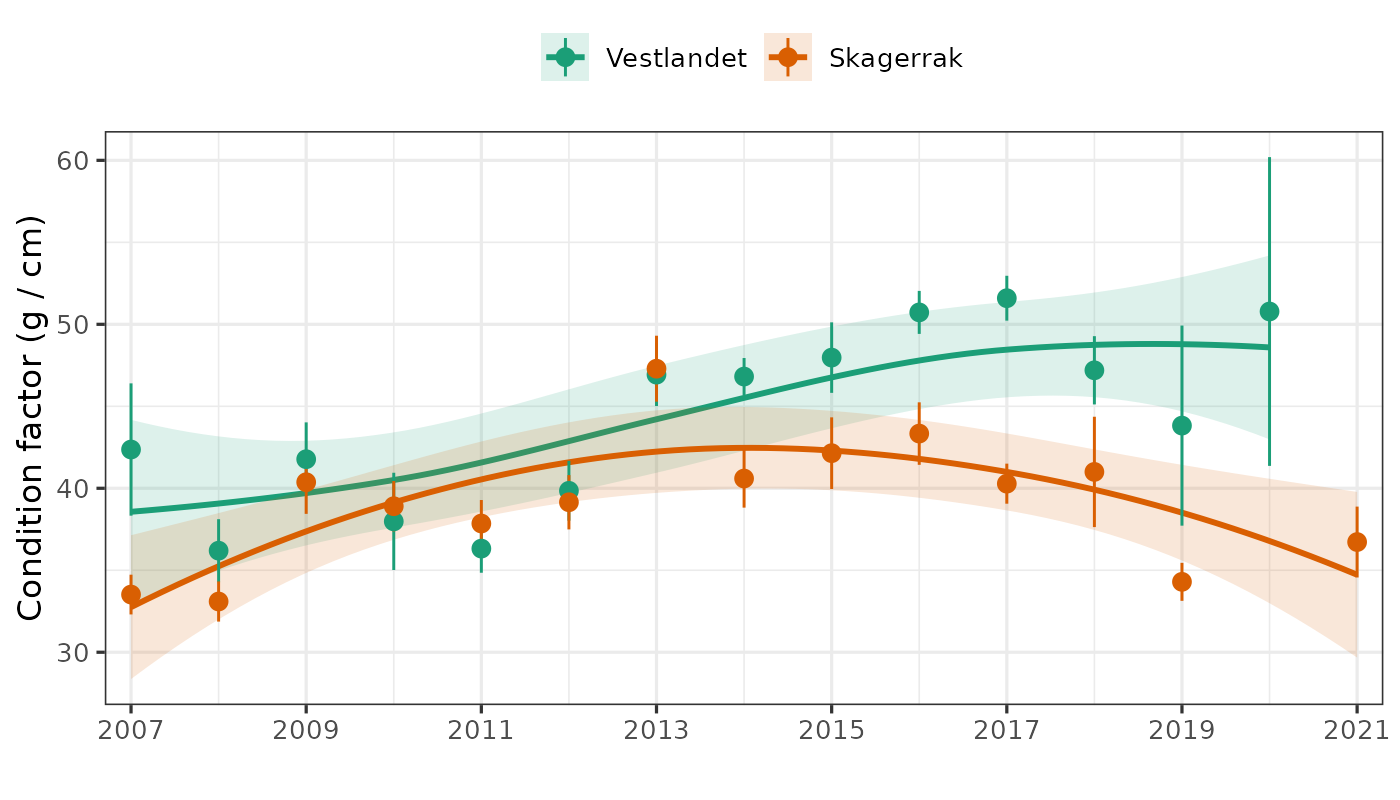
We estimated growth parameters for Skagerrak coastal cod using the gillnet survey data, aggregated (Fig. 27) and split into periods and regions (Table 3). Across periods, cod grow faster in the west than in the east (Fig. 28). In both regions, cod have been growing faster in recent years than in previous decades (Fig. 29). In recent years, the population has become age and length truncated in both regions.
Figure 28. Growth curves for Skagerrak coastal cod by period and region, gillnet survey data. In all periods, cod grow faster in the west than in the east.
Figure 29. Growth curves for Skagerrak coastal cod by period and region, gillnet survey data. In both regions, cod grow faster than in previous decades.
Area
Dataset
Years
n
Linf
k
t0
Vestlandet
Reference fleet, gillnet survey
2007-2023
8 851
98.0 (96.6, 99.6)
0.199 (0.188, 0.210)
-1.05 (-1.12, -0.98)
Skagerrak
Gillnet survey
1984-2024
13 154
81.0 (80.3, 81.7)
0.250 (0.241, 0.260)
-1.19 (-1.27, -1.11)
Skagerrak West
Gillnet survey
1984-1990
1 385
---
---
---
2001-2008
3 725
91.4 (89.1, 94.0)
0.229 (0.210, 0.247)
-1.34 (-1.47, -1.22)
2010-2016
2 184
70.4 (68.0, 73.4)
0.323 (0.280, 0.368)
-1.35 (-1.58, -1.16)
2017-2024
1 318
62.8 (61.5, 64.1)
0.518 (0.466, 0.572)
-0.82 (-0.96, -0.70)
Skagerrak East
Gillnet survey
1984-1990
1 791
76.0 (74.6, 77.5)
0.268 (0,248, 0.289)
-1.17 (-1.34, -1.03)
2001-2008
1 610
75.7 (74.5, 77.1)
0.329 (0.307, 0.351)
-0.91 (-0.97, -0.84)
2010-2016
784
83.7 (73.2, 102.4)
0.263 (0.181, 0.353)
-0.97 (-1.16, -0.83)
2017-2024
357
89.0 (74.9, 121.6)
0.240 (0.137, 0.354)
-1.01 (-1.29, -0.80)
Table 3 . Von Bertalanffy growth curve parameters for coastal cod south of 62N. --- indicates model did not converge.
8.2 - Growth (age-weight)
Weight-at-age is a more direct measure of productivity than length-at-age. The Skagerrak gillnet surveys shows that cod weight-at-age increased substantially at all ages and in both regions from the 1980s to the 2000s (Fig. 30). Weight-at-age has since declined but is still higher than the 1980s for most ages and regions. Across years, cod have generally been heavier at a given age in the west than in the east (Fig. 31). Reference fleet gillnet data from Vestlandet and Skagerrak show a similar pattern, with either stable or increasing weight-at-age in both regions and all ages (Fig. 32).
In conclusion, growth conditions for individual cod seem to have improved in all areas (Vestlandet, Skagerrak West, and Skagerrak East).
Figure 30. Weight-at-age for cod in the Skagerrak gillnet survey. Weight-at-age has generally increased in both regions and at most ages.
Figure 31. Weight-at-age for cod in the Skagerrak gillnet survey. Cod have generally been heavier at a given age in the west than in the east.
Figure 32. Weight-at-age for cod from reference fleet gillnet data.
8.3 - Condition (length-weight)
In addition to weight-at-age, condition factor (weight / length) is a useful indicator of growth conditions. The Skagerrak gillnet survey data show very different trends by region. In the west, condition has been very stable over the entire 40-year time series (Fig. 32). In the east, however, weight per length has steadily declined and is now less than 50% of what it was in the 1980s, both regions, and is currently in the west (Fig. 32).
The stable (condition factor) or improved (weight-at-age) growth conditions in Skagerrak West contrast with the strong decline in abundance observed in the last decade (Figs. 13 and 32).
The reference fleet gillnet data from 2007-2021 show that cod are heavier for given length in Vestlandet (Fig. 34). In Skagerrak, condition factor has also increased overall but was lower in 2019-2021.
Figure 33. Condition factor (weight / length) for cod in the Skagerrak gillnet survey.
Figure 34. Condition factor (weight / length) for cod in the reference fleet gillnet data.
8.4 - Maturity
We estimated the length at 50% maturity, L50, from the gillnet surveys, since the reference fleet does not catch many small, immature fish. As expected, cod mature at smaller size the further south one goes: L50 = 60.5 cm north of 67N, 55.8 cm from 62-67N, 50.7 cm in Vestlandet, 46.2 cm in Skagerrak (Fig. 35).
Simulations show that setting minimum size limits to 1.1-1.2 * L50 is likely to ensure biological sustainability and maximized yields even under heavy fishing pressure (Prince and Hordyk, 2018). South of 62N, recreational F is likely higher than commercial F, making traditional fisheries data collection (e.g. total catch and catch-at-age) and regulatory measures (e.g. controlling fishing mortality with a quota) difficult. Common recreational gear like hook-and-line and fyke nets also provide higher release survival than commercial gear like gillnets and trawls. In this situation, we advocate for setting the minimum size at 1.1 * L50. This is roughly 56 cm for Vestlandet and 51 cm for Skagerrak . The current minimum size for cod south of 62N is 40 cm. At this length, roughly 15% and 30% of cod are mature in Vestlandet and Skagerrak, respectively (Fig. 35).
Figure 35. Maturity-at-length for cod in the Vestlandet (left) and Skagerrak (right) gillnet surveys, data aggregated across all years. L50 = length at 50% maturity. 95% CI in parentheses.
Gillnet surveys in all regions show a strong trend of cod maturing at smaller size and younger age (Fig. 36). Cod in both Skagerrak regions used to mature around 50 cm and 3-4 years old, and now mature around 40 cm and 1.5 years old in the west, and 33 cm and 1 year old in the east (Fig. 36). Maturing at younger age in eastern Skagerrak is consistent with previous work (Olsen et al., 2008; Roney et al., 2016) and the expectation of a population under high fishing pressure. Whether these trends are due to shifting proportions of cod ecotypes, or phenotypic vs. genotypic responses are unclear and should be investigated in the future. Monitoring the age- and size-at-maturity has been suggested as a warning sign of fishery collapses (Olsen et al., 2004a; Trippel 1995).
Figure 36. Trend in maturity length (left) and age (right) from the Vestlandet and Skagerrak gillnet surveys, data aggregated into periods.
8.5 - Recruitment (age-1)
Although we do not yet have a population assessment that integrates catch and survey abundance-at-age data and directly estimates recruitment, we can use the age-1 survey indices as an indicator (Figs. 16 and 21). Along the Skagerrak coast, the extensive beach seine survey is a better source of data on age-0 cod abundance. Finally, we note that age-1 cod in the gillnet surveys are roughly 1.5 years old, 30-45 cm, and have likely experienced significant fishing mortality already by this age.
The Vestlandet survey time series is short (9 years) and does not show significant trend. Recruitment in the Skagerrak West and East areas has been variable but shows a clear decline since 2001. Although recruitment in Skagerrak West has declined, it is not lower than it was in the 1980s (Fig. 16).
Figure 37. Recruitment (age-1 index) trend from the Vestlandet and Skagerrak gillnet surveys. Annual estimates are points with 95% CI error bars. Linear trends are dashed lines with 95% CI shaded. Trend is significant for Skagerrak West and East, not significant for Vestlandet.
Strong 2016- and 2019- cohorts (i.e. age-1 in 2017 and 2020) were seen in all three areas (positive recruitment deviations, Fig. 36). Recruitment deviations were correlated between Skagerrak West and Skagerrak East, and weakly correlated between Vestlandet and Skagerrak (Fig. 38).
Figure 38. Correlation of recruitment deviations between Vestlandet, Skagerrak West, and Skagerrak East from 2001-2023. Deviations are the age-1 index minus long term trend, i.e. residuals of the linear regressions in Fig. 37.
9 - Evaluation of available data for assessment
9.1 - Vestlandet
9.2 - Skagerrak (West and East)
One of the larger uncertainties with any assessment of coastal cod south of 62N is the population structure. In Skagerrak, it is well-documented that two ecotypes overlap (fjord cod and oceanic/North Sea cod). Yet, none of the fishery and survey time series can be split by ecotype to estimate abundance by ecotype. The Skagerrak gillnet survey has collected tissue samples for genetics since 2011, and genotyping these samples would enable us to estimate abundance by ecotype for 2011-2024. This would be especially useful for the Skagerrak West area because this covers a few years of high abundance, 2011-2017, before the steep decline occurred, 2017-2024. We could then see if the decline has been only in one ecotype, or both.
Without the ability to split data by ecotype, assumptions must be made about what spatial and temporal extent represent ‘coastal cod’. If we use convenient boundaries for management, e.g. within the baseline, within 4 nm, or within 12 nm, and these do not correspond to biological population structure, we risk either over- or underestimating status and sustainable harvest levels.
Nevertheless, it is reasonable to use these data as the basis of coastal cod assessments for the three areas analyzed here, all within the baseline: Vestlandet, Skagerrak West, Skagerrak East. The gillnet surveys are within the baseline, in the skerries and nearshore habitat. The slower growing, more vulnerable Skagerrak fjord ecotype is mainly found within the baseline. Both surveys have good ability to track cohorts, i.e. the indices-at-age are consistent, which indicates they are either monitoring one population or multiple populations that are in sync. The very different trends in abundance and life history between Skagerrak West and Skagerrak East indicate that it is appropriate to estimate population status separately in these regions. Life history parameters (growth, mortality, maturity) are quite different between Vestlandet and Skagerrak, justifying splitting these population areas.
The commercial catch data can reasonably be taken as reliable. Discard estimates are not available but since cod is, or has been, a target species they are not likely to be substantial. The catches cannot currently be split by age or ecotype. There is a possibility of using reference fleet data to estimate commercial catch age composition since 2006, although which gears are covered and if they are representative of the total commercial catch should be considered. The catches could be split by gear for 1977-present. Catches can currently be split within/outside 12 nm for 1977-present. Splitting at 4 nm or the baseline would take significant effort but could be done starting in 1996 using FDIR location, or in 2005 by combining sales notes and logbooks.
Recreational fishing is a significant source of mortality on coastal cod in all areas south of 62N. Thus, the lack of recreational effort and catch data (both tourist and resident) is a limitation. Point estimates of recreational F exist and could be used to make a rough approximation of recreational catch to add to the commercial catch. This would also require a big assumption about the trend over time. However, assuming zero recreational catch is far from the truth. If an age-based assessment is used, further assumptions on how to split recreational catch by age would also be needed.
The two available abundance indices from the reference fleet CPUE and the gillnet surveys show the same trends within stock area. The survey indices-at-age have good ability to track cohorts. The length, age, weight, and maturity data from the surveys would be useful in an age-based assessment. The Vestlandet survey lacks weight data or tissue samples for genetics, and these would be good to add in the future. The large changes in growth and maturity, especially in Skagerrak, should be considered by using an age-based model or allowing for time-varying productivity in a surplus production model. A Vestlandet assessment is likely to be more difficult or uncertain since the gillnet survey index is a short time series (2015-2023, 9 years) and the reference fleet CPUE index has high uncertainty. The Skagerrak gillnet survey spans 41 years (1984-2024, missing 1991-2000) and is more likely to produce an assessment with reasonably low uncertainty.
10 - Potential assessment methods
10.1 - Length-based, e.g. LBSPR
The simplest type of model would be a length-based assessment, e.g. LBSPR (Hordyk et al., 2015, 2016) . The only data required is a representative length distribution, although assumptions about the fishery must be made, e.g. if selectivity is logistic or dome-shaped. The LBSPR model also requires life history parameter estimates (natural mortality, growth, maturity), which are used to determine the expected length distribution without fishing. Then the degree of ‘missing’ larger fish removed by the fishery in the observed length distribution is used to estimate SPR, spawning potential ratio, which can be used for management. The method is somewhat familiar within IMR, as an LBSPR model was developed for the adjacent coastal cod stock to the north (Norwegian coastal cod 62-67N; ICES, 2021) .
The method is feasible, since the gillnet surveys collect life history data that can be used to estimate key parameters. However, the LBSPR model assumes equilibrium conditions, and the clear changes in productivity (growth, maturity, recruitment) do not conform to this assumption. Furthermore, commercial catch and survey indices-at-age are available that could support a more detailed model, discussed below.
10.2 - Surplus production model, e.g. SPiCT
Surplus production models, e.g. SPiCT (Pedersen and Berg, 2017), require time series of catch and relative abundance. SPiCT models the aggregate biomass of fish targeted by fishing, removing the need for length- or age-based data. It estimates maximum sustainable yield, MSY, and the population status relative to MSY. IMR is also familiar with the method, which is currently used to assess coastal cod 62-67N (ICES, 2024b, 2024c). Much of the required data and analyses to support SPiCT assessments of coastal cod south of 62N have been presented here.
Additional work is needed to estimate recreational catch, because in these stock areas recreational F has been shown to exceed commercial F in recent years (Kleiven et al., 2016; Jorde et al. 2018). The uncertainty in recreational catch makes the estimate of total catch uncertain. In addition, the relative importance of commercial versus recreational fishing has likely changed significantly as the commercial catch steeply declined after 2000.
SPiCT also requires a definition of ‘exploitable biomass’, i.e. the size fish are caught in the fishery. Abundance indices must then be calculated for just fishery-size cod. This is relatively straightforward and could be done with existing data.
SPiCT is worth considering for coastal cod south of 62N. However, it would ignore the reliable survey age data. The standard SPiCT model also does not account for changes in productivity, although extensions to estimate time-varying productivity have been developed and could be explored (Mildenberger et al., 2019) .
10.3 - Survey-only model, e.g. SURBAR
If a time-series of recreational catch cannot be constructed or is considered too unreliable, then the total catch may also be too unreliable. In this case, the SURBAR model could be used, which only requires an index-at-age from survey data (Cook, 2013; Nelson, 2019) . Disadvantages to this approach are that it would:
ignore the signal in the decline of commercial catch over the longer-term (Fig. 6), even though the recreational fishery was relatively less important in previous decades,
be unable to update if the surveys are not continued (as possible under current budget pressure, Vestlandet survey was not conducted in 2024), and
limit the assessment years to the years with survey data. The gillnet surveys start in 1984 (Skagerrak) and 2015 (Vestlandet), whereas commercial catch is available from 1914.
10.4 - Age-based analytical, e.g. Stock Synthesis or SAM
An age-based model could be developed, such as Stock Synthesis (Methot and Wetzel, 2013), SAM (Nielsen and Berg, 2014), or WHAM (Stock and Miller, 2021). This would be the most complex option, requiring not just total catch but catch-at-age. For the commercial catch, reference fleet data could be used to split the catch by age. Estimating catch-at-age in addition to total catch by the recreational fishery would require big assumptions but could be done. It could also be worth attempting an age-based model with missing catch proportions-at-age since these are uncertain.
One advantage of an age-based model is that it would make use of the survey indices-at-age developed here to estimate recruitment and year class strength. In addition, it would account for time-varying productivity by using annual data on weight- and maturity-at-age, and by estimating annual recruitment.
The best source of data on age-0 cod abundance in Skagerrak is the beach seine survey. These data should be used in an age-based assessment and checked for correlation between age-0 beach seine and ages 1-4 in the gillnet survey.
11 - References
Aglen, A., Nedreaas, K. H., Moland, E., Knutsen, H., Kleiven, A. R., Johannessen, T., Wehde, H., et al. 2016. Status of cod along the coast in southern Norway. Fisken og Havet. Institute of Marine Research.
Anderson, S. C., Ward, E. J., English, P. A., Barnett, L. A. K., and Thorson, J. T. 2024, February 5. sdmTMB: An R Package for Fast, Flexible, and User-Friendly Generalized Linear Mixed Effects Models with Spatial and Spatiotemporal Random Fields. bioRxiv. https://www.biorxiv.org/content/10.1101/2022.03.24.485545v3 (Accessed 19 April 2024).
Barcelo, C., Ciannelli, L., Olsen, E. M., Johannessen, T., and Knutsen, H. 2016. Eight decades of sampling reveal a contemporary novel fish assemblage in coastal nursery habitats. Glob Chang Biol, 22: 1155–67.
Barth, J. M. I., Berg, P. R., Jonsson, P. R., Bonanomi, S., Corell, H., Hemmer-Hansen, J., Jakobsen, K. S., et al. 2017. Genome architecture enables local adaptation of Atlantic cod despite high connectivity. Mol Ecol, 26: 4452–4466.
Barth, J. M. I., Villegas-Rios, D., Freitas, C., Moland, E., Star, B., Andre, C., Knutsen, H., et al. 2019. Disentangling structural genomic and behavioural barriers in a sea of connectivity. Mol Ecol, 28: 1394–1411.
Breistein, B., Dahle, G., Johansen, T., Besnier, F., Quintela, M., Jorde, P. E., Knutsen, H., et al. 2022. Geographic variation in gene flow from a genetically distinct migratory ecotype drives population genetic structure of coastal Atlantic cod (Gadus morhua L.). Evolutionary Applications, 15: 1162–1176.
Clegg, T., and Williams, T. 2020. Monitoring bycatches in Norwegian fisheries: Species registered by the Norwegian Reference Fleet 2015–2018. Rapport fra Havforskningen. Havforskningsinstituttet.
Clemens, B. J., and Schreck, C. B. 2021. An assessment of terminology for intraspecific diversity in fishes, with a focus on “ecotypes” and “life histories”. Ecology and Evolution, 11: 10772–10793.
Cook, R. M. 2013. A fish stock assessment model using survey data when estimates of catch are unreliable. Fisheries Research, 143: 1–11.
Espeland, S. H., Gundersen, A. F., Olsen, E. M., Knutsen, H., Gjøsæter, J., and Stenseth, N. C. 2007. Home range and elevated egg densities within an inshore spawning ground of coastal cod. ICES Journal of Marine Science, 64: 920–928.
Fernández-Chacón, A., Moland, E., Espeland, S. H., Kleiven, A. R., and Olsen, E. M. 2017. Causes of mortality in depleted populations of Atlantic cod estimated from multi-event modelling of mark–recapture and recovery data. Canadian journal of fisheries and aquatic sciences, 74: 116–126.
Ferter, K., Otterå, H., Christman, M., Kleiven, A. R., Weltersbach, M. S., Gundersen, S., Djønne, C., et al. 2023. Integrating complementary survey methods to estimate catches in Norway’s complex marine recreational hook-and-line fishery. ICES Journal of Marine Science, 80: 107–121.
Froese, R., Winker, H., Gascuel, D., Sumaila, U. R., and Pauly, D. 2016. Minimizing the impact of fishing. Fish and Fisheries, 17: 785–802.
Fuglebakk, E., and Thorsen, A. 2024. Skreitokt 2024: Kartlegging av gytebestanden av skrei i 2024. Toktrapport, 2024–23. Havforskningsinstituttet.
Hordyk, A., Ono, K., Valencia, S., Loneragan, N., and Prince, J. 2015. A novel length-based empirical estimation method of spawning potential ratio (SPR), and tests of its performance, for small-scale, data-poor fisheries. ICES Journal of Marine Science, 72: 217–231.
Hordyk, A. R., Ono, K., Prince, J. D., and Walters, C. J. 2016. A simple length-structured model based on life history ratios and incorporating size-dependent selectivity: application to spawning potential ratios for data-poor stocks. Canadian journal of fisheries and aquatic sciences, 73: 1787–1799.
Huserbråten, M. B. O., Moland, E., and Albretsen, J. 2018. Cod at drift in the North Sea. Progress in Oceanography, 167: 116–124.
ICES. 2015. Report of the Benchmark Workshop on North Sea Stocks (WKNSEA). ICES CM 2015/ACOM.
ICES. 2020. Workshop on Stock Identification of North Sea Cod (WKNSCodID). ICES Scientific Reports.
ICES. 2021. Benchmark Workshop for Barents Sea and Faroese Stocks (WKBARFAR 2021). ICES Scientific Reports.
ICES. 2022. Workshop on Stock Identification of West of Scotland Sea Cod (WK6aCodID; outputs from 2021 meeting). ICES Scientific Reports.
ICES. 2024a. Working Group on the Assessment of Demersal Stocks in the North Sea and Skagerrak (WGNSSK). ICES Scientific Reports. https://doi.org/10.17895/ices.pub.25605639.v2.
ICES. 2024b. Benchmark workshop 3 on the development of MSY advice using SPiCT (WKBMSYSPiCT3). 6:6. ICES Scientific Reports. https://doi.org/10.17895/ices.pub.24998858 (Accessed 28 May 2024).
ICES. 2024c. Report of the Arctic Fisheries Working Group (AFWG). ICES Scientific Reports. https://doi.org/10.17895/ices.pub.25970272.v1.
Johansen, T., Besnier, F., Quintela, M., Jorde, P. E., Glover, K. A., Westgaard, J., Dahle, G., et al. 2020. Genomic analysis reveals neutral and adaptive patterns that challenge the current management regime for East Atlantic cod Gadus morhua L . Evolutionary Applications, 13: 2673–2688.
Jorde, P. E., Knutsen, H., Espeland, S. H., and Stenseth, N. C. 2007. Spatial scale of genetic structuring in coastal cod Gadus morhua and geographic extent of local populations. Marine Ecology Progress Series, 343: 229–237.
Jorde, P. E., Kleiven, A. R., Sodeland, M., Olsen, E. M., Ferter, K., Jentoft, S., Knutsen, H., et al. 2018. Who is fishing on what stock: population-of-origin of individual cod (Gadus morhua) in commercial and recreational fisheries. ICES Journal of Marine Science, 75: 2153–2162.
Julliard, R., Stenseth, N. Chr., Gjøsæter, J., Lekve, K., Fromentin, J.-M., and Danielssen, D. S. 2001. Natural Mortality and Fishing Mortality in a Coastal Cod Population: A Release–Recapture Experiment. Ecological Applications, 11: 540–558.
Kleiven, A. R., Fernandez-Chacon, A., Nordahl, J.-H., Moland, E., Espeland, S. H., Knutsen, H., and Olsen, E. M. 2016. Harvest Pressure on Coastal Atlantic Cod (Gadus morhua) from Recreational Fishing Relative to Commercial Fishing Assessed from Tag-Recovery Data. PLoS One, 11: e0149595–e0149595.
Kleiven, A. R., Ferter, K., Otterå, H., and Vølstad, J. H. (in prep). Notat foreløpige resultater fritidsfiske Oslofjorden.
Knutsen, H., Olsen, E. M., Ciannelli, L., Espeland, S. H., Knutsen, J. A., Simonsen, J. H., Skreslet, S., et al. 2007. Egg distribution, bottom topography and small-scale cod population structure in a coastal marine system. Marine Ecology Progress Series, 333: 249–255.
Knutsen, H., Jorde, P. E., Hutchings, J. A., Hemmer-Hansen, J., Gronkjaer, P., Jorgensen, K. M., Andre, C., et al. 2018. Stable coexistence of genetically divergent Atlantic cod ecotypes at multiple spatial scales. Evolutionary Applications, 11: 1527–1539.
Knutsen, H., Espeland, S. H., and Moland, E. 2022. Evaluation of measures for the protection of coastal cod in Skagerrak introduced June 2019. Rapport fra havforskningen. Institute of Marine Research.
Kristensen, M. L., Olsen, E. M., Moland, E., Knutsen, H., Gronkjaer, P., Koed, A., Kallo, K., et al. 2021. Disparate movement behavior and feeding ecology in sympatric ecotypes of Atlantic cod. Ecol Evol, 11: 11477–11490.
Kuparinen, A., Roney, N. E., Oomen, R. A., Hutchings, J. A., and Olsen, E. M. 2016. Small-scale life history variability suggests potential for spatial mismatches in Atlantic cod management units. ICES Journal of Marine Science, 73: 286–292.
Methot, R. D., and Wetzel, C. R. 2013. Stock synthesis: A biological and statistical framework for fish stock assessment and fishery management. Fisheries Research, 142: 86–99.
Mildenberger, T. K., Berg, C. W., Pedersen, M. W., Kokkalis, A., Nielsen, J. R., and Zhou, S. 2019. Time-variant productivity in biomass dynamic models on seasonal and long-term scales. ICES Journal of Marine Science.
Nedreaas, K., Aglen, A., Gjøsæter, J., Jørstad, K., Knutsen, H., Smedstad, O., Svåsand, T., et al. 2008. Management of cod in Western Norway and on the Skagerrak coast--stock status and possible management measures. Fisken og Havet. Institute of Marine Research, Bergen, Norway.
Nelson, G. A. 2019. Bias in common catch-curve methods applied to age frequency data from fish surveys. ICES Journal of Marine Science, 76: 2090–2101.
Nielsen, A., and Berg, C. W. 2014. Estimation of time-varying selectivity in stock assessments using state-space models. Fisheries Research, 158: 96–101.
Ogle, D. H. 2016. Introductory Fisheries Analyses with R. CRC Press, Wisconsin, USA.
Ogle, D. H., Doll, J. C., Wheeler, A. P., and Dinno, A. 2023. FSA: Simple Fisheries Stock Assessment Methods. https://fishr-core-team.github.io/FSA/.
Olsen, E. M., Heino, M., Lilly, G. R., Morgan, M. J., Brattey, J., Ernande, B., and Dieckmann, U. 2004a. Maturation trends indicative of rapid evolution preceded the collapse of northern cod. Nature, 428: 932–935.
Olsen, E. M., Knutsen, H., Gjøsæter, J., Jorde, P. E., Knutsen, J. A., and Stenseth, N. C. 2004b. Life-history variation among local populations of Atlantic cod from the Norwegian Skagerrak coast. Journal of Fish Biology, 64: 1725–1730.
Olsen, E. M., Knutsen, H., Gjosaeter, J., Jorde, P. E., Knutsen, J. A., and Stenseth, N. C. 2008. Small-scale biocomplexity in coastal Atlantic cod supporting a Darwinian perspective on fisheries management. Evolutionary Applications, 1: 524–533.
Olsen, E. M., and Moland, E. 2011. Fitness landscape of Atlantic cod shaped by harvest selection and natural selection. Evolutionary Ecology, 25: 695–710.
Otterå, H., Bjelland, O., Hinriksson, J., Næss, H., and Nedreaas, K. 2024. Prøvefiske med trollgarn og åleruser på grunt vatn om hausten: Strekninga Florø Bergen i perioden 2015-2023. Toktrapport, 2024–4. Institute of Marine Research.
Pedersen, M. W., and Berg, C. W. 2017. A stochastic surplus production model in continuous time. Fish and Fisheries, 18: 226–243.
Prince, J., and Hordyk, A. 2018. What to do when you have almost nothing: A simple quantitative prescription for managing extremely data‐poor fisheries. Fish and Fisheries, 20: 224–238.
Rogers, L. A., Olsen, E. M., Knutsen, H., and Stenseth, N. C. 2014. Habitat effects on population connectivity in a coastal seascape. Marine Ecology Progress Series, 511: 153–163.
Roney, N. E., Hutchings, J. A., Olsen, E. M., Knutsen, H., Albretsen, J., and Kuparinen, A. 2016. Fine-scale life-history structure in a highly mobile marine fish. Evolutionary Ecology Research, 17: 95–109.
Smith, M. W., Then, A. Y., Wor, C., Ralph, G., Pollock, K. H., and Hoenig, J. M. 2012. Recommendations for Catch-Curve Analysis. North American Journal of Fisheries Management, 32: 956–967. AFS Website.
Sodeland, M., Jentoft, S., Jorde, P. E., Mattingsdal, M., Albretsen, J., Kleiven, A. R., Synnes, A.-E. W., et al. 2022. Stabilizing selection on Atlantic cod supergenes through a millennium of extensive exploitation. Proceedings of the National Academy of Sciences, 119: e2114904119.
Søvik, G., Zimmermann, F., Olsen, S. A., and Thangstad, T. H. 2024. Toktrapport fra reketoktet i Skagerrak og Norskerenna 2024. Toktrapport, 2024–22. Havforskningsinstituttet.
Spies, I., Hauser, L., Jorde, P. E., Knutsen, H., Punt, A. E., Rogers, L. A., and Stenseth, N. C. 2018. Inferring genetic connectivity in real populations, exemplified by coastal and oceanic Atlantic cod. Proc Natl Acad Sci U S A, 115: 4945–4950.
Stock, B. C., and Miller, T. J. 2021. The Woods Hole Assessment Model (WHAM): A general state-space assessment framework that incorporates time- and age-varying processes via random effects and links to environmental covariates. Fisheries Research, 240: 105967.
Svåsand, T., and Kristiansen, T. S. 1990. Enhancement studies of coastal cod in western Norway. Part IV. Mortality of reared cod after release. ICES Journal of Marine Science, 47: 30–39.
Synnes, A.-E. W., Huserbråten, M., Knutsen, H., Jorde, P. E., Sodeland, M., Moland, E., and Raicevich, S. 2021. Local recruitment of Atlantic cod and putative source spawning areas in a coastal seascape. ICES Journal of Marine Science, 78: 3767–3779.
Taylor, N. G., Walters, C. J., and Martell, S. J. D. 2005. A new likelihood for simultaneously estimating von Bertalanffy growth parameters, gear selectivity, and natural and fishing mortality. Canadian journal of fisheries and aquatic sciences, 62: 215–223.
Trippel, E. A. 1995. Age at maturity as a stress indicator in fisheries. BioScience, 45: 759–771.
Zhou, S., Yin, S., Thorson, J. T., Smith, A. D. M., and Fuller, M. 2012. Linking fishing mortality reference points to life history traits: an empirical study. Canadian Journal of Fisheries and Aquatic Sciences, 69: 1292–1301. NRC Research Press.
Zhou, S., Punt, A. E., Lei, Y., Deng, R. A., and Hoyle, S. D. 2020. Identifying spawner biomass per‐recruit reference points from life‐history parameters. Fish and Fisheries, 21: 760–773.
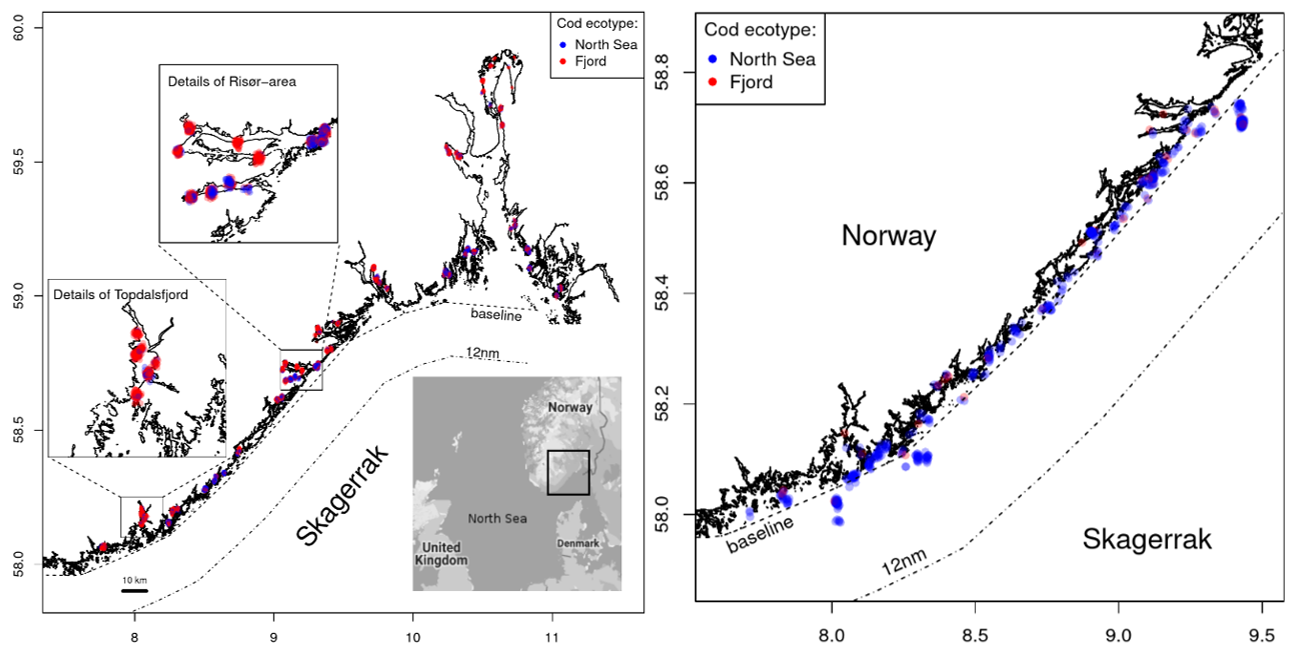
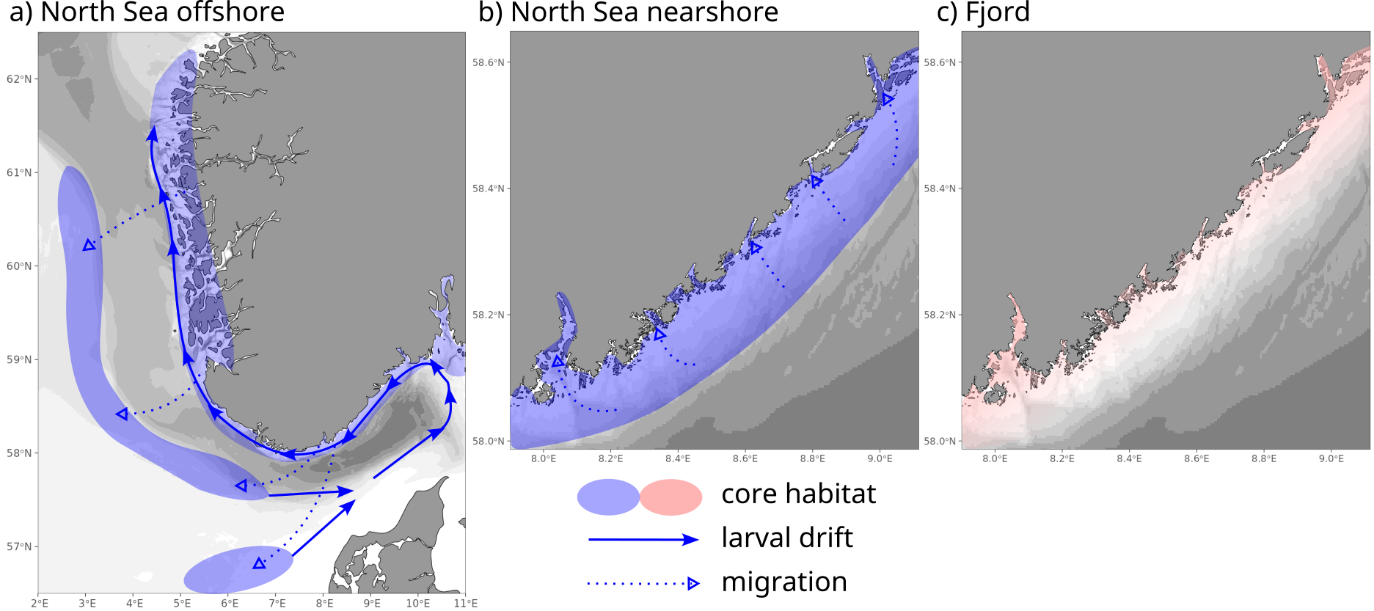
 than cod from the outer fjord.