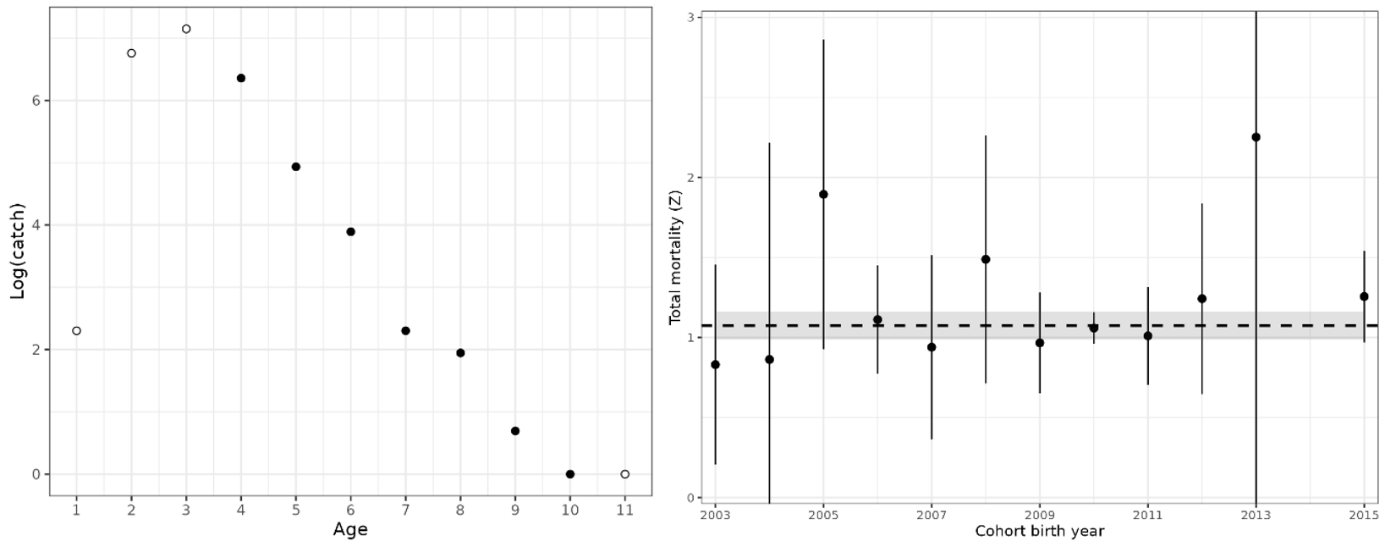
Figure 22. Left: Catch curve, log(catch-at-age), for cod in coastal reference fleet data from Skagerrak, 2007-2023. Black points show ages used in the aggregate catch curve, and white points show ages excluded (ages 1-3 on ascending limb and age-11 on the descending limb was above age-10). Right: Catch curve estimates of total mortality, Z, by cohort. Points with 95% CI are cohort-specific estimates, and the dashed line is the weighted average (with 95% CI shaded).