Gå til hovedinnhold
Havforskningsinstituttet
HI
English
<- Tilbake
Søk
Søk
Søk
View page in English
Figur
Fra rapporten:
Oppdatert status om torsk langs Vestlandet- og Skagerrakkysten: potensial for bestandsvurdering
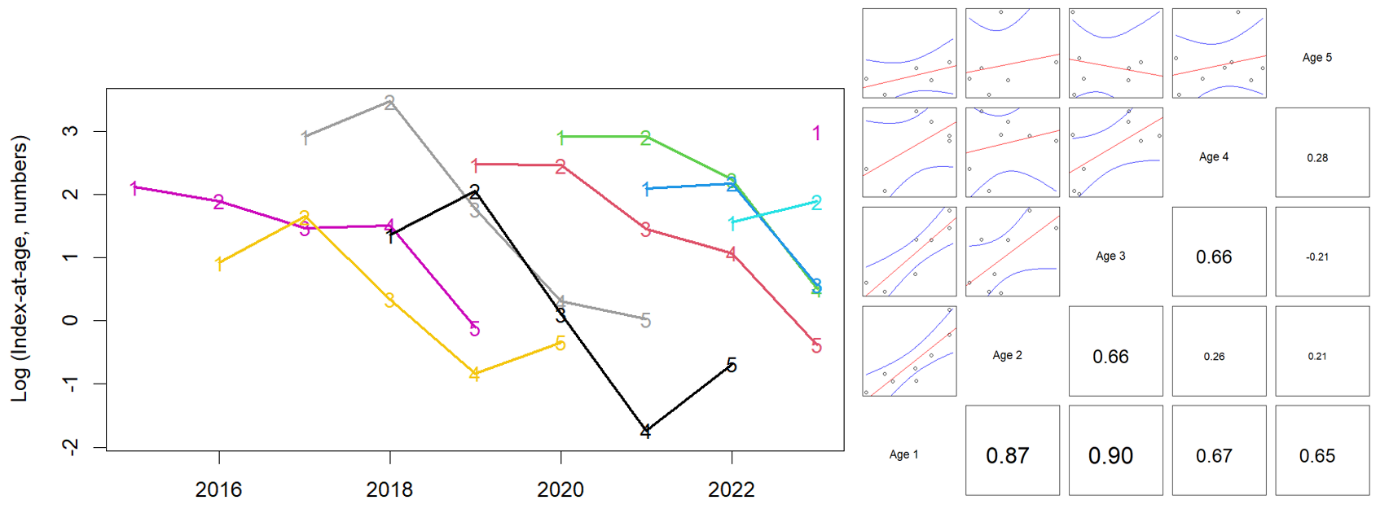
Figure 20. Index-at-age consistency for ages 1-5+ in the Vestlandet gillnet survey. Left: cohort plot of log(numbers-at-age). Right: upper-left panels show log(numbers-at-age) by cohort, and lower-right panels show correlation coefficients.