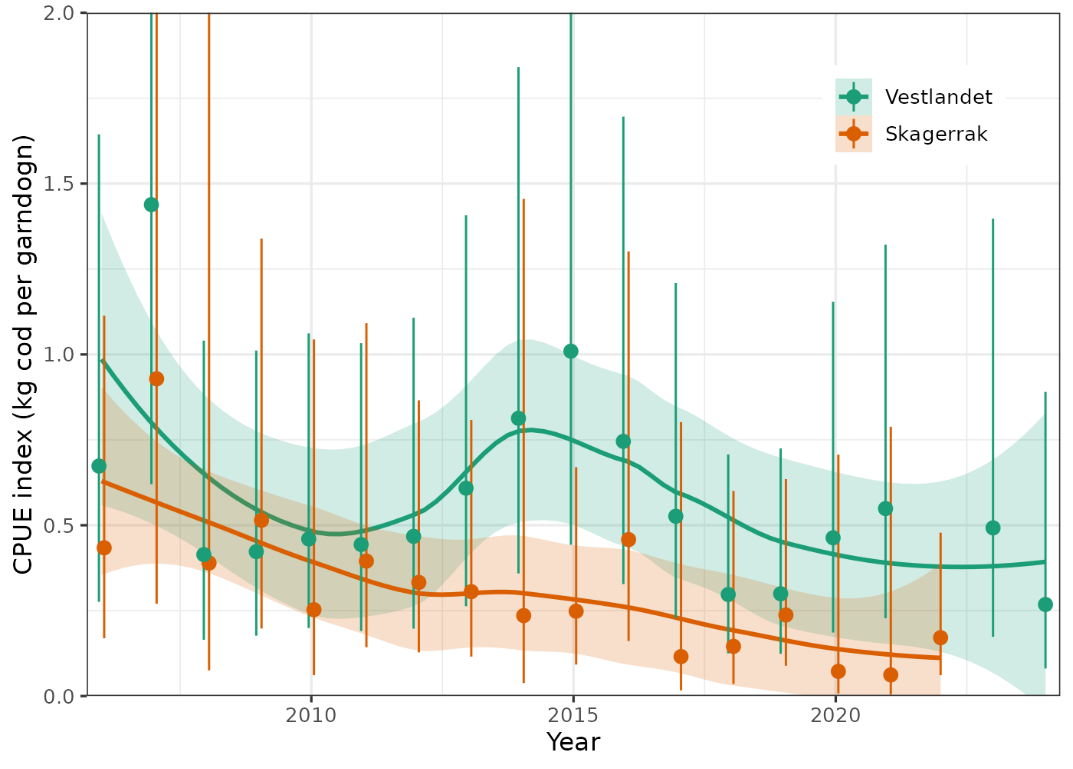
Figure 9. Gillnet CPUE indices for cod along the Vestlandet and Skagerrak coasts. Data from the Norwegian reference fleet, 2006-2024. Annual index values are shown as points and 95% CI are error bars. Trend is shown with a loess smoother, i.e. stats::loess in R, with 95% CI shaded.