Gå til hovedinnhold
Havforskningsinstituttet
HI
English
<- Tilbake
Søk
Søk
Søk
View page in English
Figur
Fra rapporten:
Oppdatert status om torsk langs Vestlandet- og Skagerrakkysten: potensial for bestandsvurdering
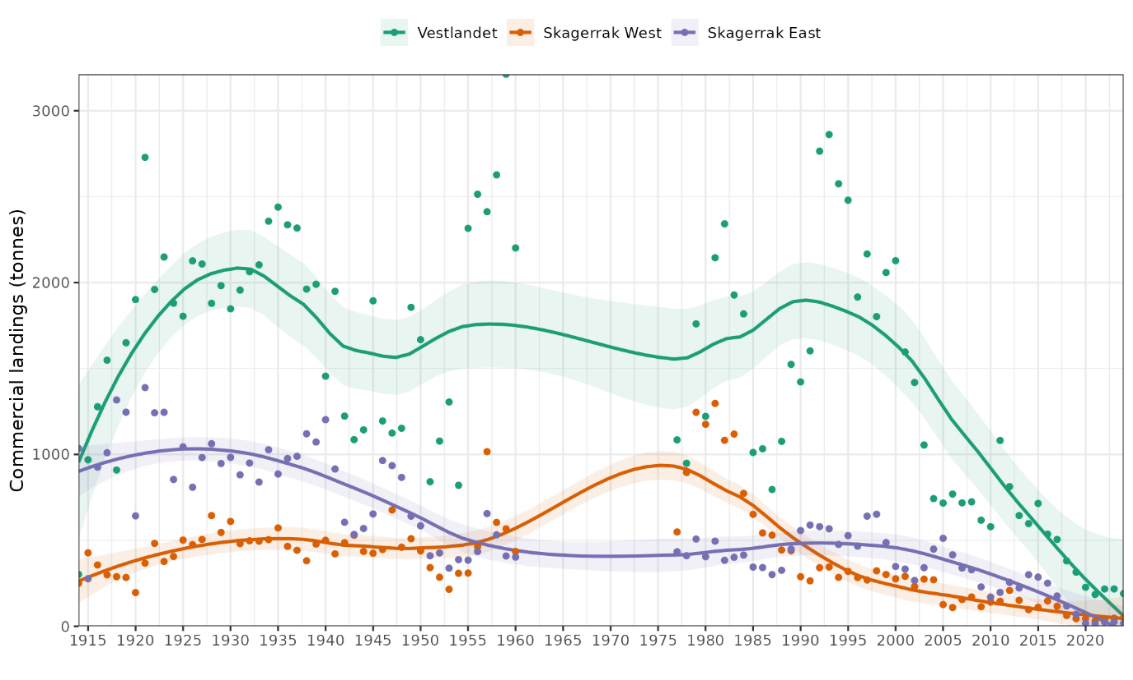
Figure 6. Commercial landings of coastal cod south of 62N, 1914-2024. Annual values are shown as points. Mean trend is shown with a loess smoother with span = 0.5 and 95% CI shaded.