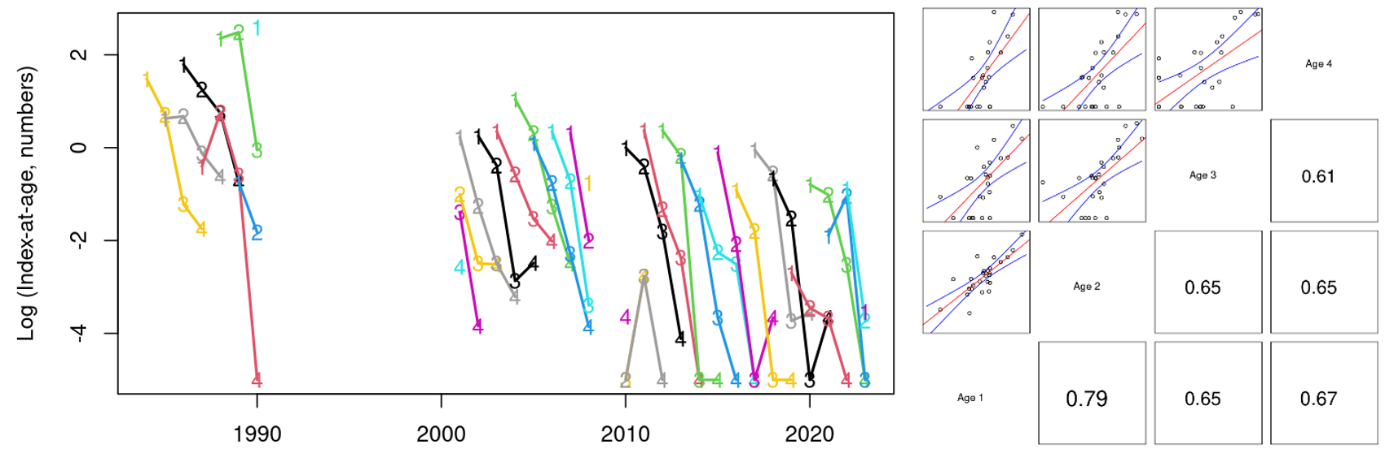
Figure 15. Skagerrak East index-at-age consistency for ages 1-4 in the Skagerrak gillnet survey. Left: cohort plot of log(numbers-at-age). Right: upper-left panels show log(numbers-at-age) by cohort, and lower-right panels show correlation coefficients.