Gå til hovedinnhold
Havforskningsinstituttet
HI
English
<- Tilbake
Søk
Søk
Søk
View page in English
Figur
Fra rapporten:
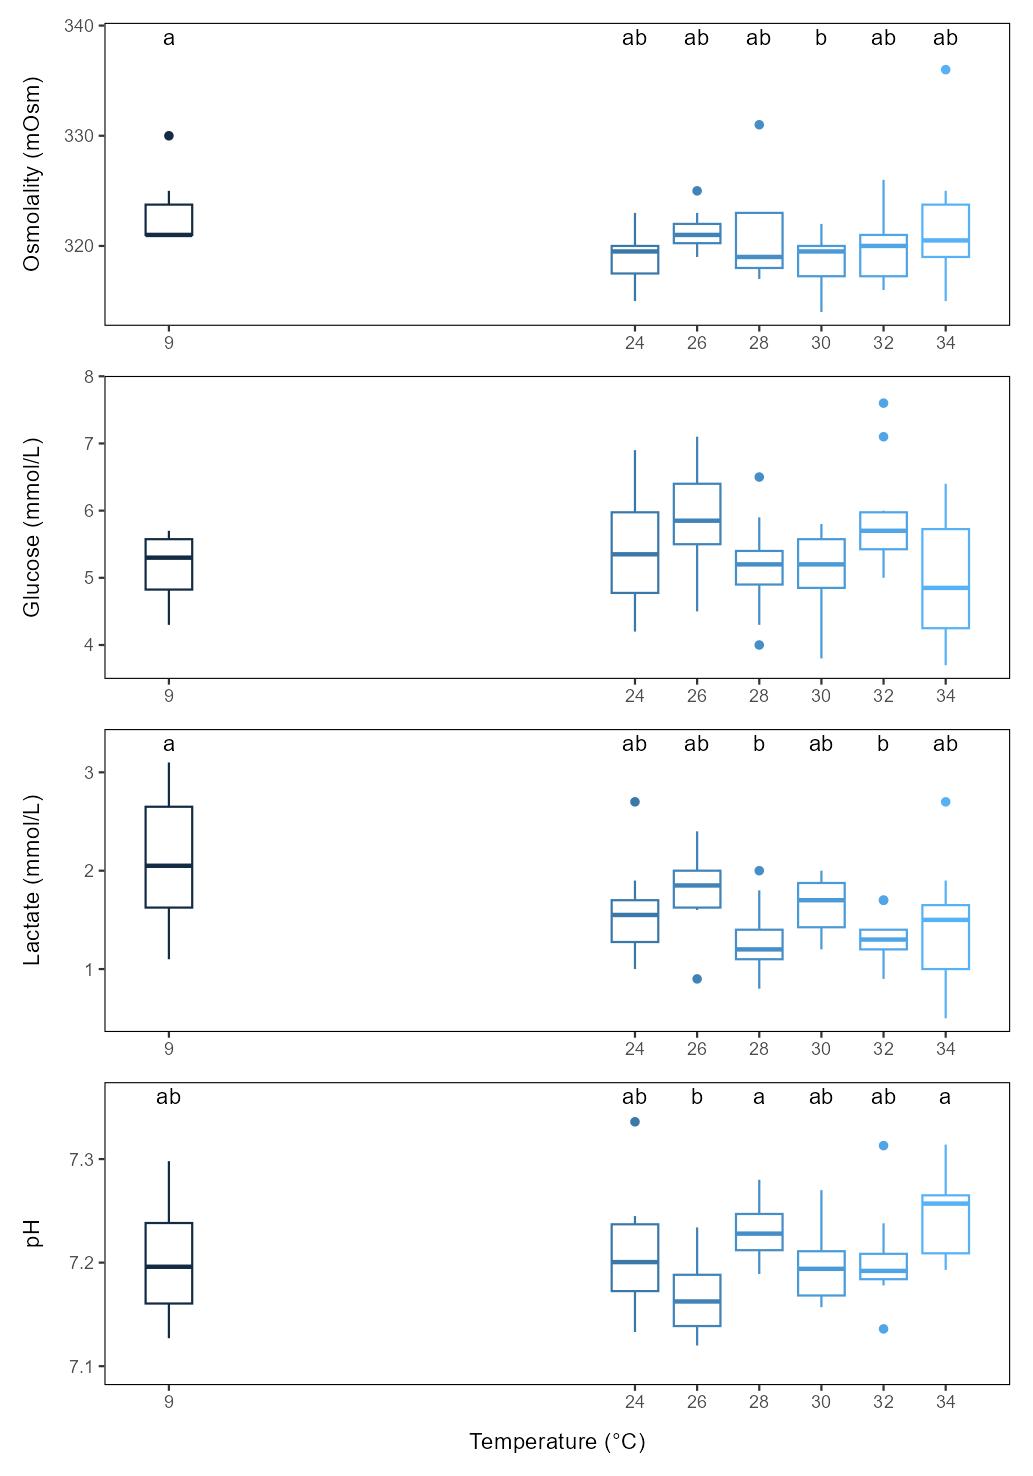
Effect of thermal and freshwater treatments on rainbow trout welfare, physiology, and infestation levels.
Figure. 5.2. Boxplots of plasma levels of osmolality, glucose, lactate and pH of small rainbow trout sampled 3 days after thermal exposure of varying temperatures.