Gå til hovedinnhold
Havforskningsinstituttet
HI
English
<- Tilbake
Søk
Søk
Søk
View page in English
Figur
Fra rapporten:
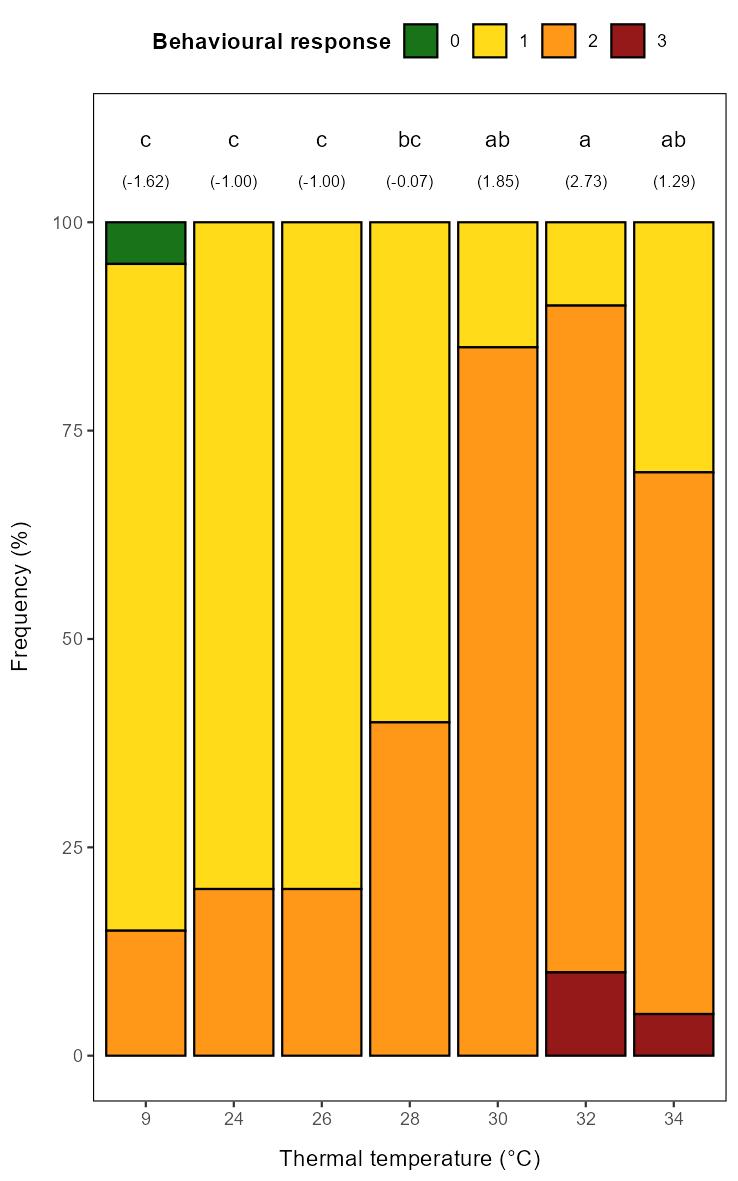
Effect of thermal and freshwater treatments on rainbow trout welfare, physiology, and infestation levels.
Figure 5.3. Distribution of scores describing the intensity of the behavioural response of small rainbow trout exposed to different thermal temperatures.