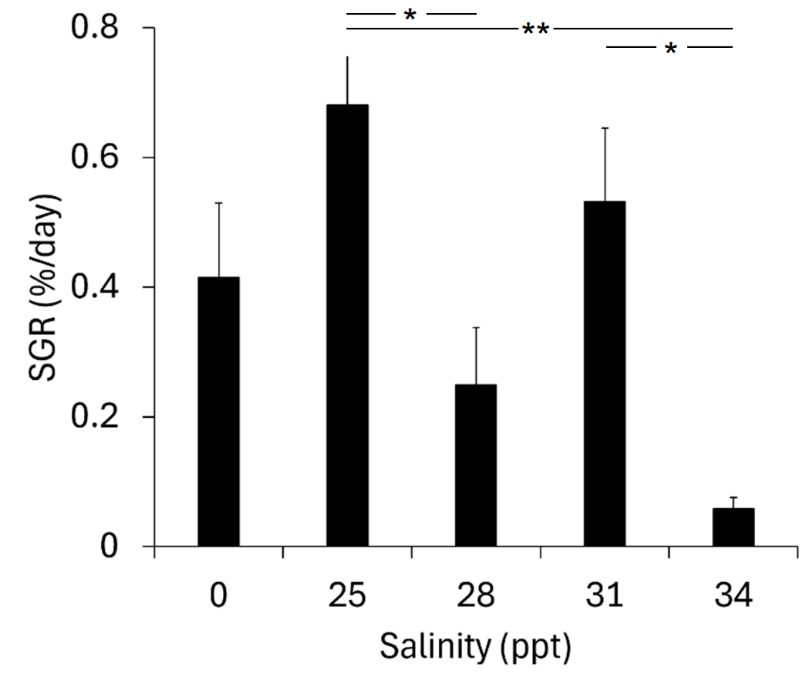
Figure 3.2. Mean specific growth rate in the different salinity groups during the 21-day study period, based on tank mean weight on days 0 and 21. Whiskers indicate standard error (n=4 tanks/salinity). Asterisks indicate significant differences between groups given by Tukey post hoc test after detection of main effect by one-way Anova, *p<0.05, **p<0.01.