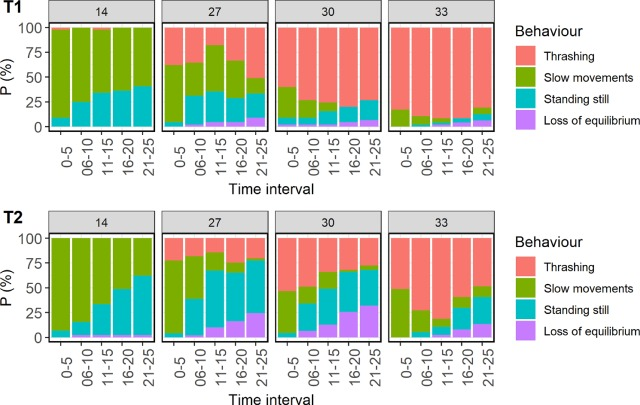
Figure 8.1. Proportion of time spent exhibiting specific behaviours in treatment vessels during first (T1) and second (T2) treatment. Time intervals during treatment are divided into the first 5 s, 6–10, 11–15, 16–20 and 21–25 s of treatment. Films of 44–47 individuals per treatment were analysed at T1, and films of 37–49 individuals at T2. Figure from Bui et al. (2022).