Gå til hovedinnhold
Havforskningsinstituttet
HI
English
<- Tilbake
Søk
Søk
Søk
View page in English
Figur
Fra rapporten:
Effect of thermal and freshwater treatments on rainbow trout welfare, physiology, and infestation levels.
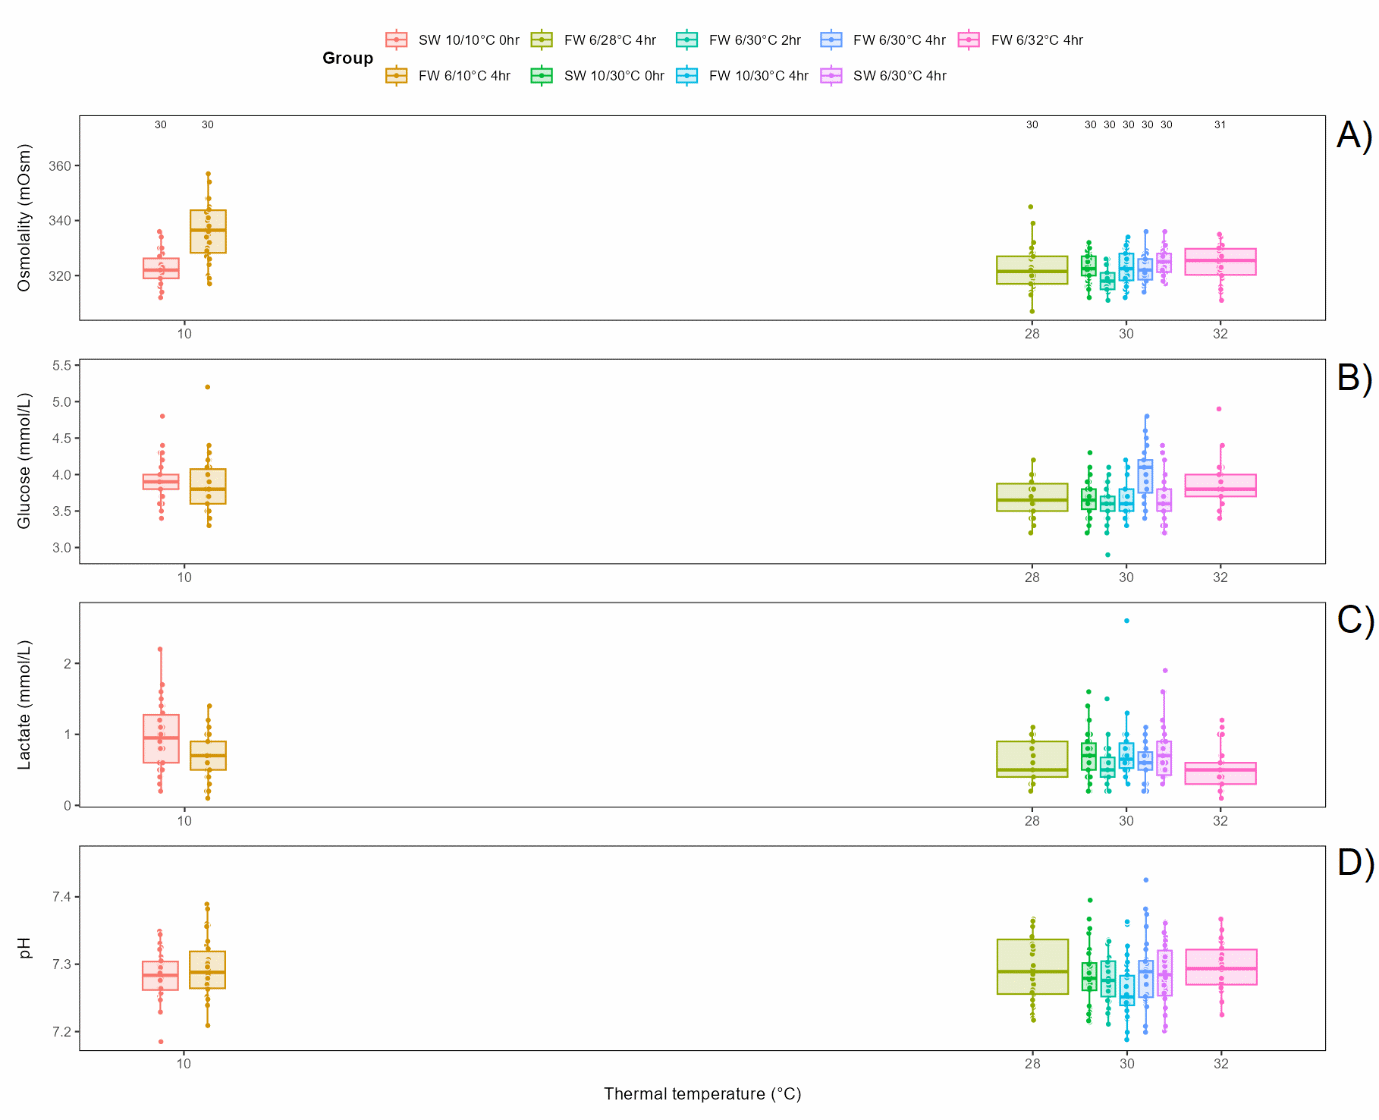
Figure 6.6. Overview of plasma levels in all treatment groups after 3 days recovery in seawater. A) osmolality, B) glucose, C) lactate, and D) pH. Numbers above the bars in A) indicate number of individuals for that group.