Gå til hovedinnhold
Havforskningsinstituttet
HI
English
<- Tilbake
Søk
Søk
Søk
View page in English
Figur
Fra rapporten:
Effect of thermal and freshwater treatments on rainbow trout welfare, physiology, and infestation levels.
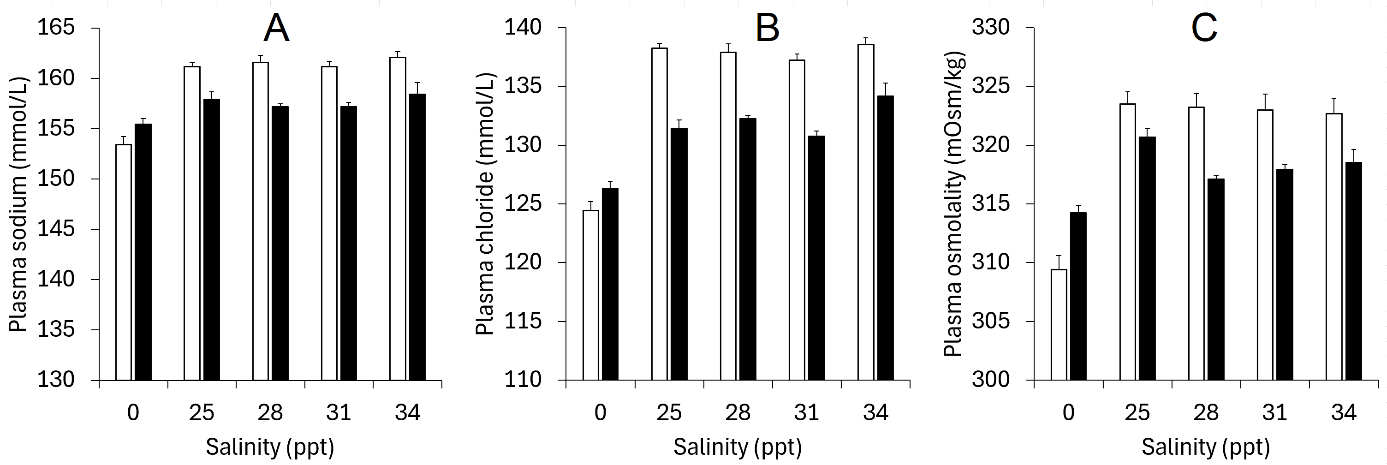
Figure 3.1. Plasma sodium (A), chloride (B) and osmolality (C) on day 1 (white bars) and 21 (black bars) after transfer from freshwater to different salinities. Whiskers indicate standard error (n=12 fish per group).