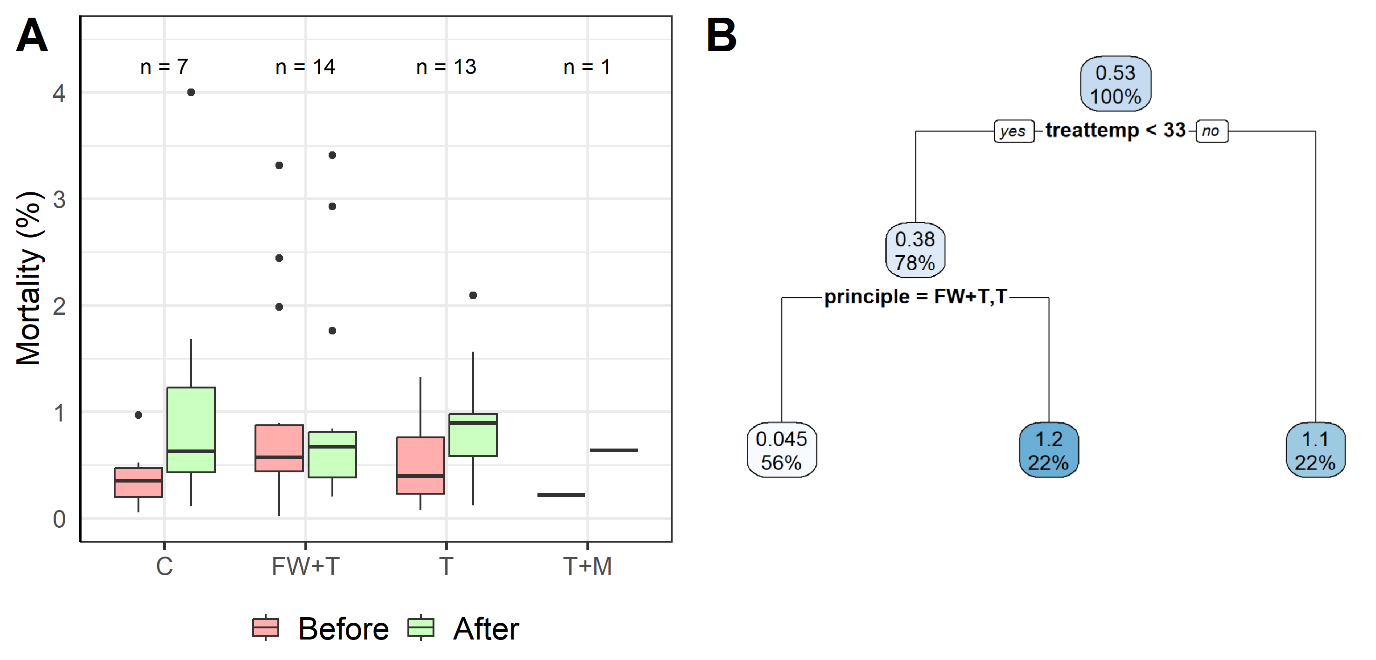
Figure 7.1. A) Boxplot of registered mortality in the four weeks before versus the four weeks after commercial delousing treatments (including on the treatment day). B) Result of recursive partitioning tree analysis (rpart, R) with percentage-point difference of mortality in the 4 weeks after versus the 4 weeks before as response variable and sea temperature, treatment temperature, and treatment principle as explanatory factors. Treatments represented are chemotherapeutant (C), freshwater bath (FW), thermal exposure (T), mechanical treatment (M), or a combination of them (+). NB: Mortality data was not reported for all the events, total n is therefore 35 in figure A, and in B we filtered out cases with unusual high mortality before delousing (>2%) and also thermal + Mechanical treatment, since there was only one such observation with complete mortality data, resulting in a dataset of 32.