Gå til hovedinnhold
Havforskningsinstituttet
HI
English
<- Tilbake
Søk
Søk
Søk
View page in English
Figur
Fra rapporten:
MAREANO's first cruise to the Arctic Mid-Ocean Ridge
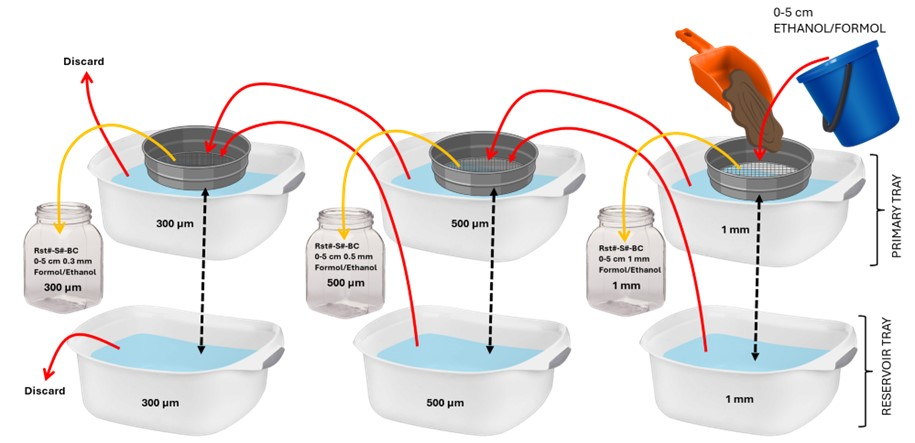
Figure 12. Schematic of the sieving workflow for the 0-5 cm layer of the boxcore sediment samples. Note that two set-ups like the one shown were used for ethanol fixed and formalin fixed halves of the box core.