Gå til hovedinnhold
Havforskningsinstituttet
HI
English
<- Tilbake
Søk
Søk
Søk
View page in English
Figur
Fra rapporten:
MAREANO's first cruise to the Arctic Mid-Ocean Ridge
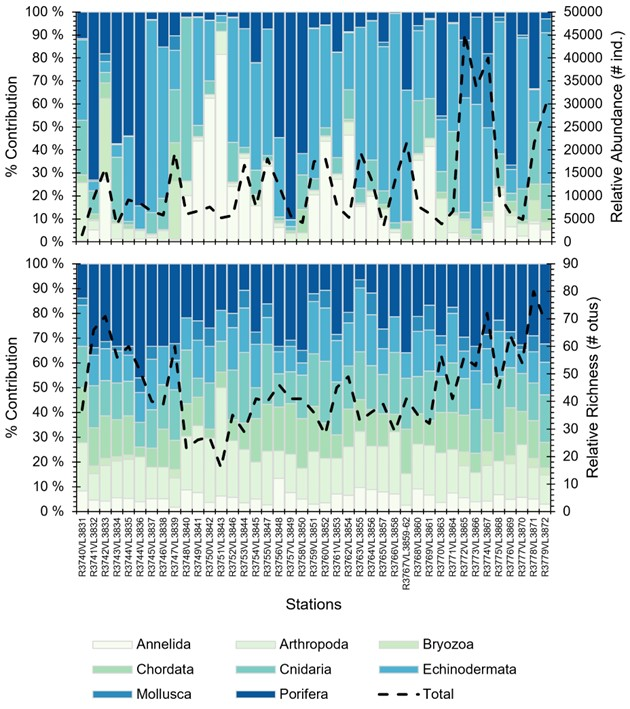
Figure 15 . Percent contribution and relative abundance (top) and relative richness (bottom) of the main phyla observed for each reference station.