Gå til hovedinnhold
Havforskningsinstituttet
HI
English
<- Tilbake
Søk
Søk
Søk
View page in English
Figur
Fra rapporten:
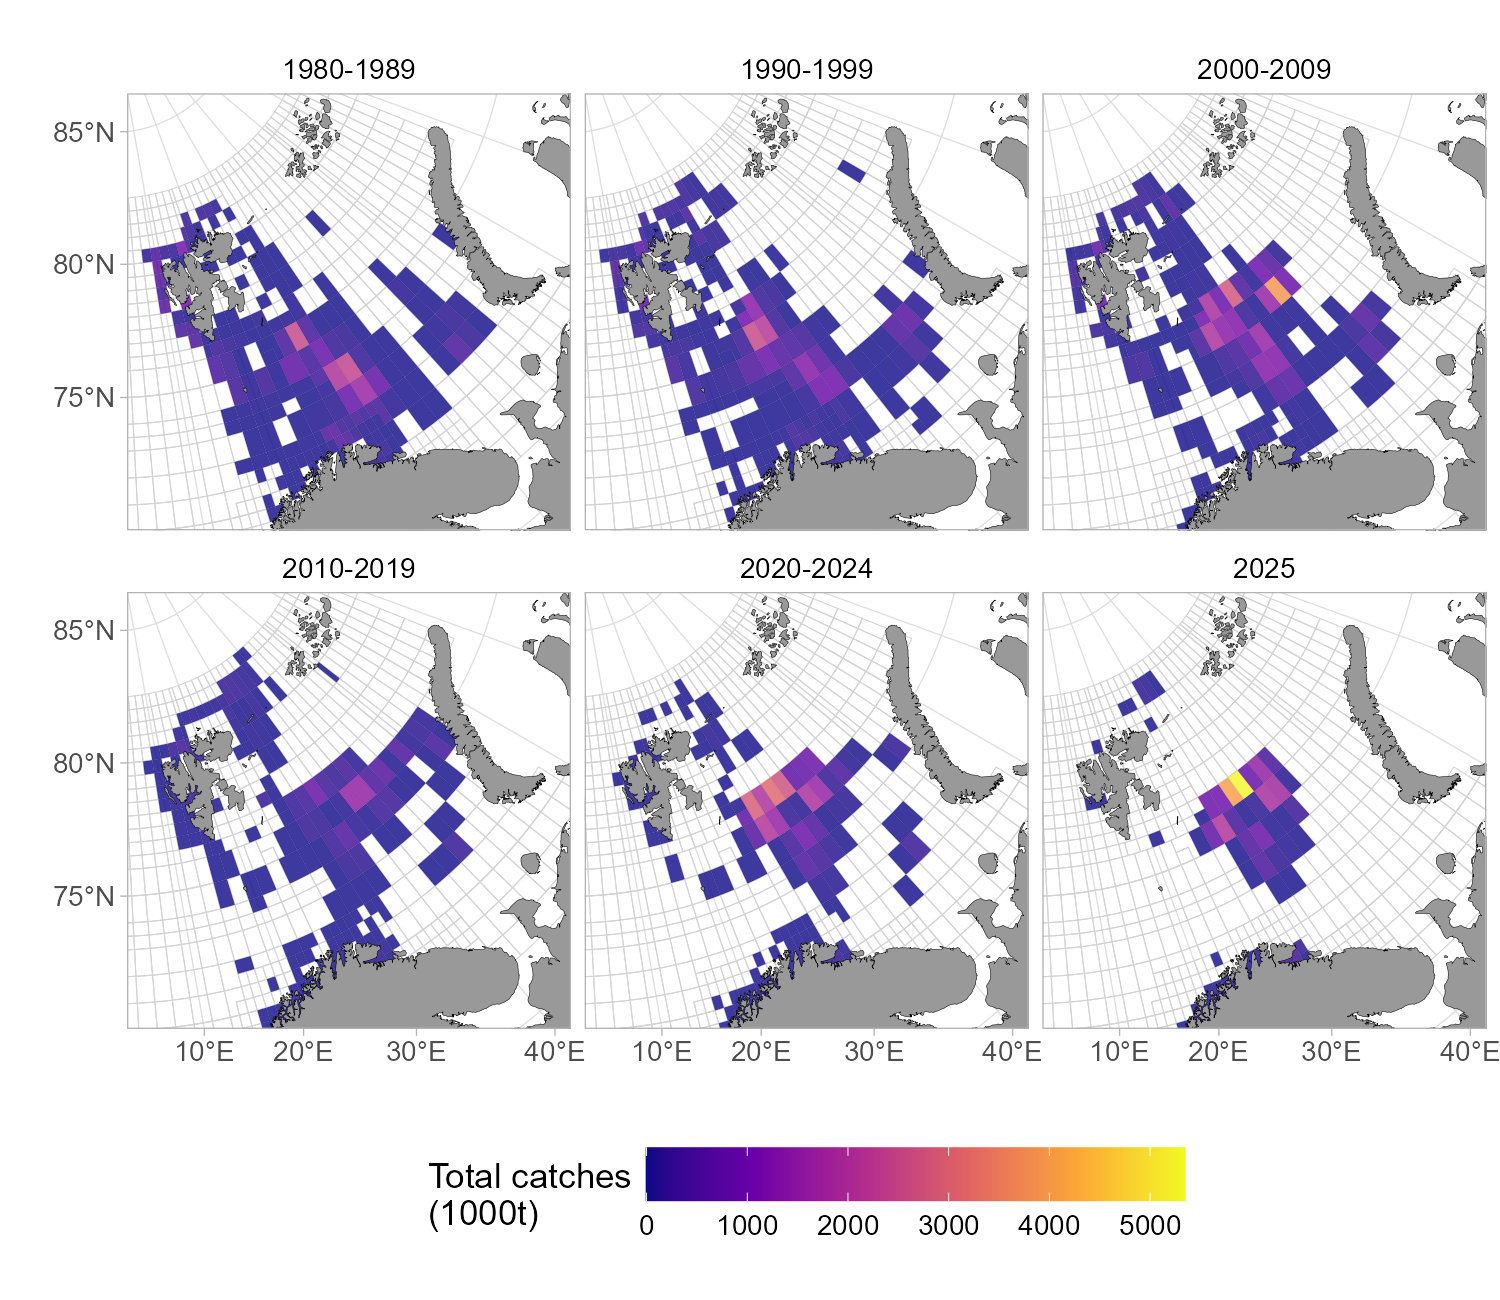
Assessment report for northern shrimp (Pandalus borealis) in the Barents Sea (ICES subareas 1 and 2)
Figure 3: Distribution of annual catches by Norwegian vessels since 1980 based on logbook information. For periods before 2020, mean annual catches across a decade are shown. 2025 includes only data until October.