Gå til hovedinnhold
Havforskningsinstituttet
HI
English
<- Tilbake
Søk
Søk
Søk
View page in English
Figur
Fra rapporten:
Assessment report for northern shrimp (Pandalus borealis) in the Barents Sea (ICES subareas 1 and 2)
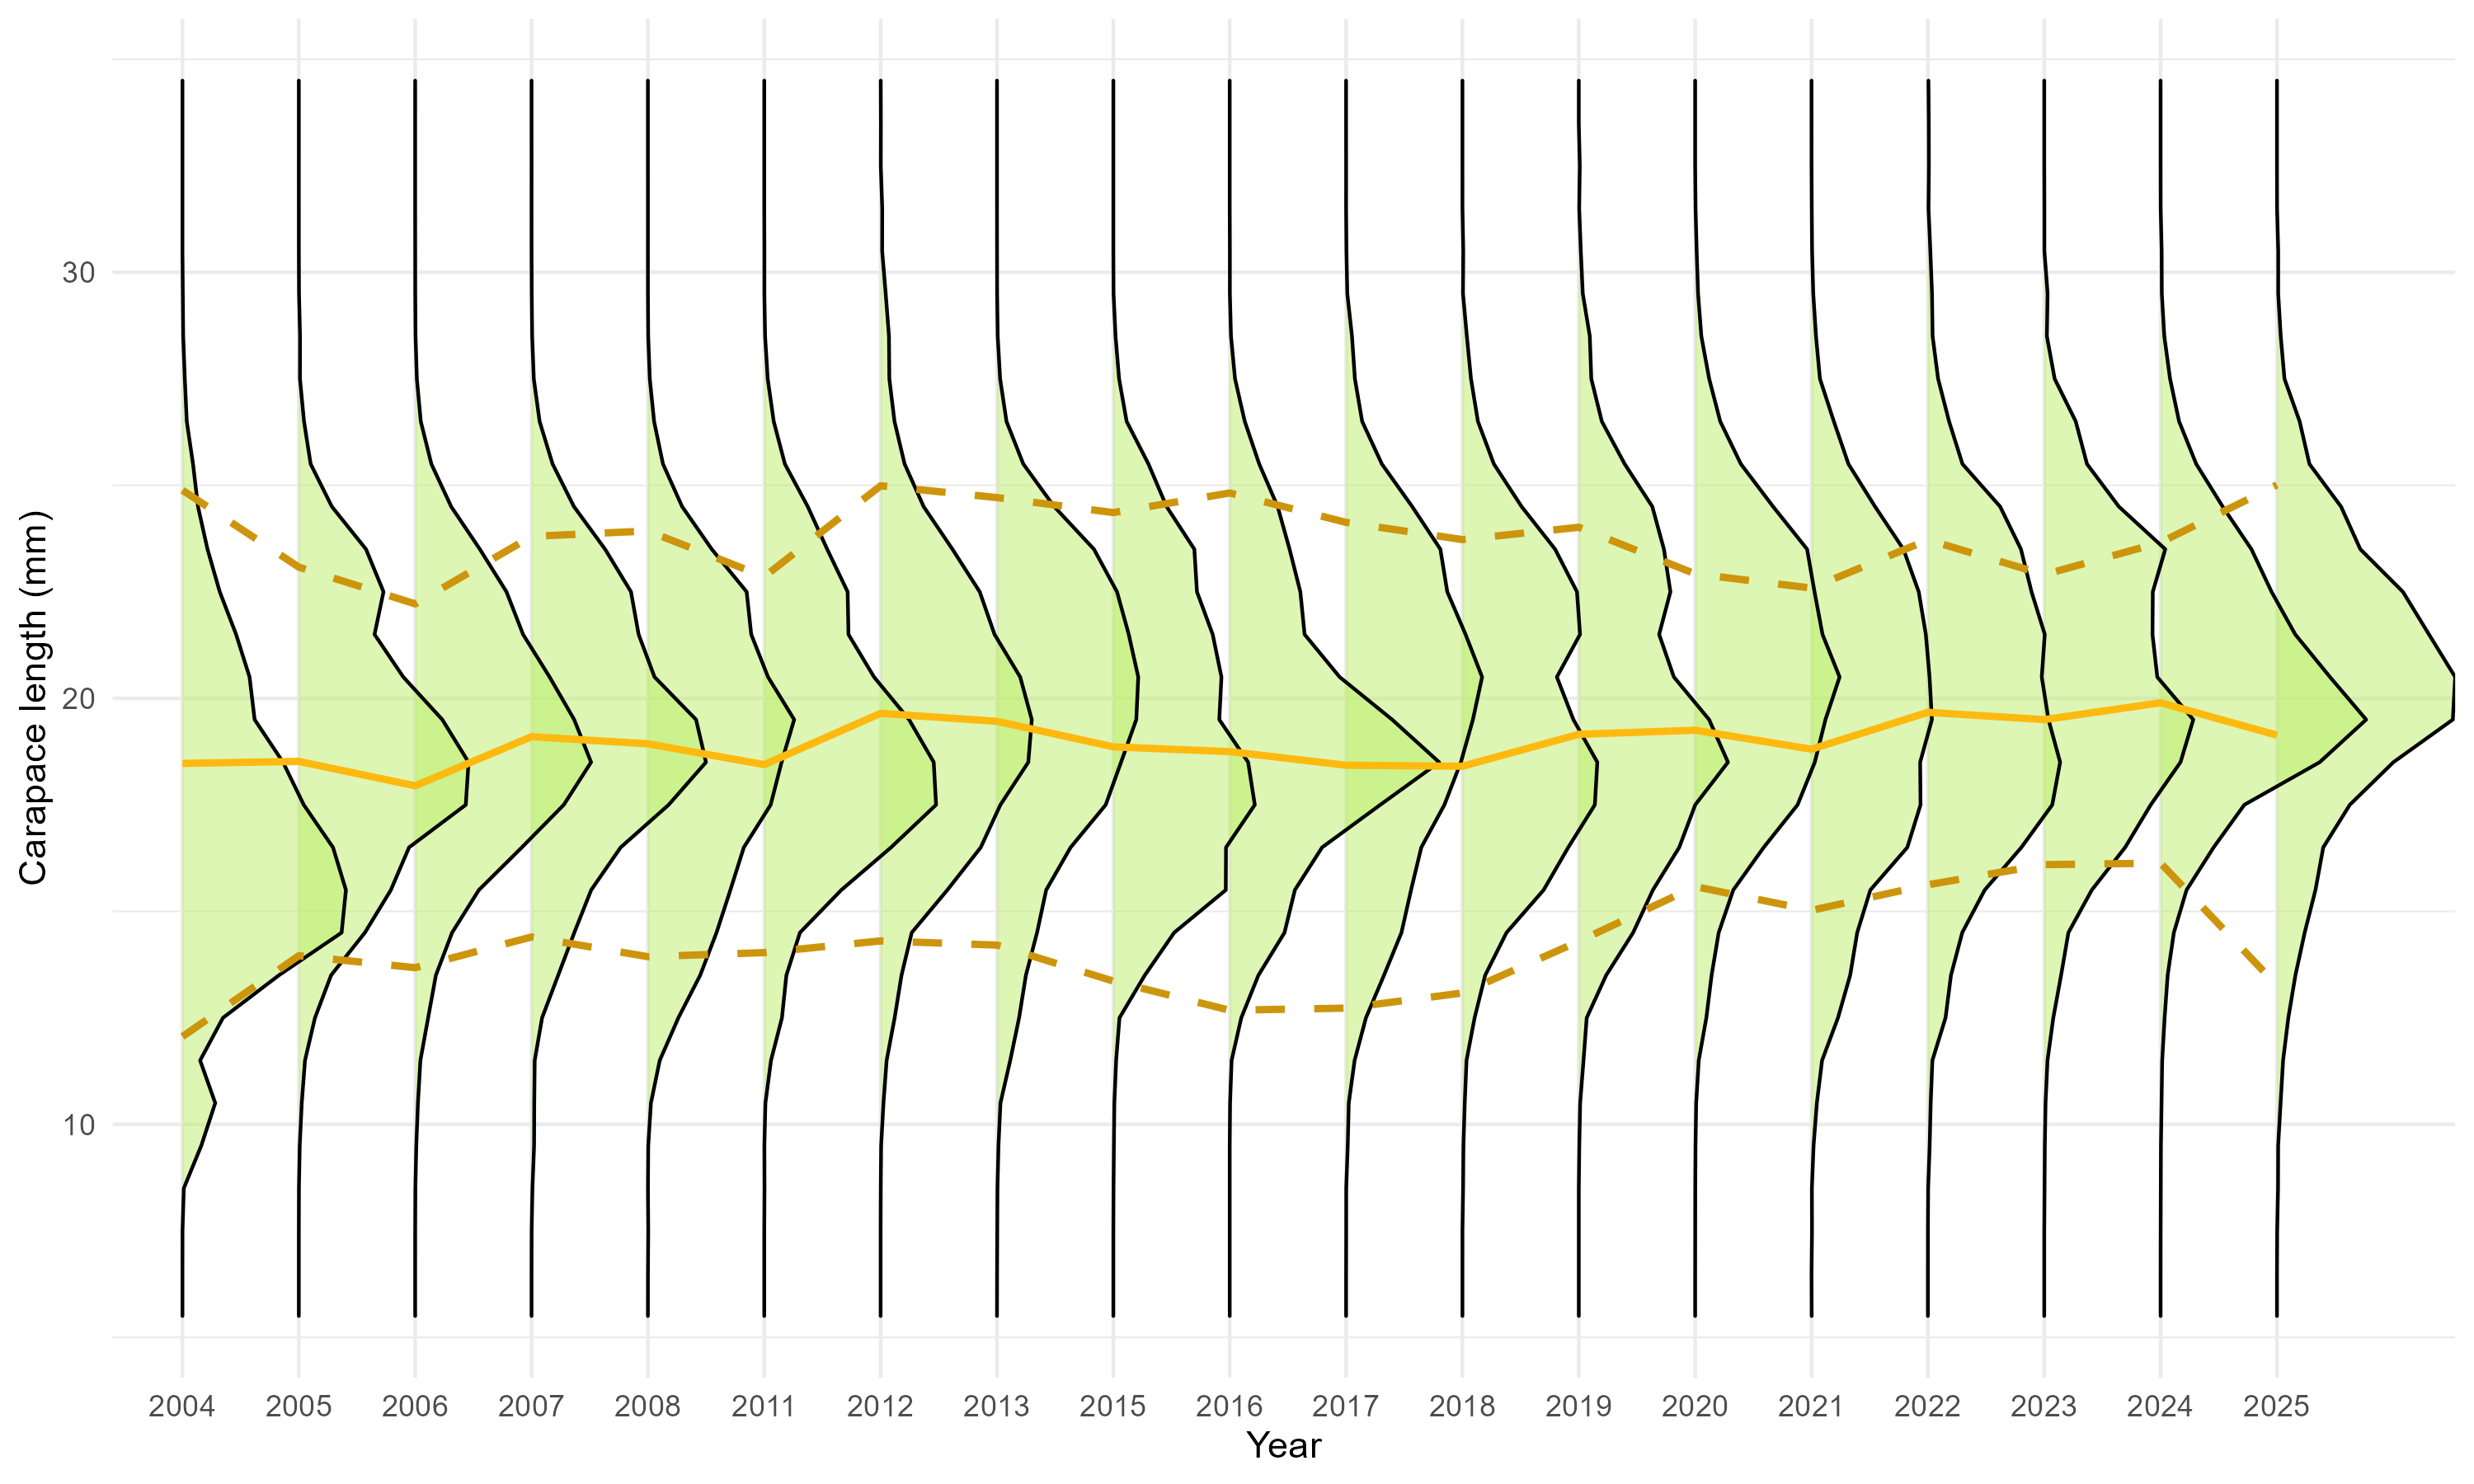
Figure 7: Shrimp length frequencies over time with predicted mean (solid line) and standard error (dashed line) overlayed. The years 2009, 2010 and 2014 were omitted because no individual data was available. Shown size range was restricted to <35mm.